Download
1 / 33
340 likes | 563 Views
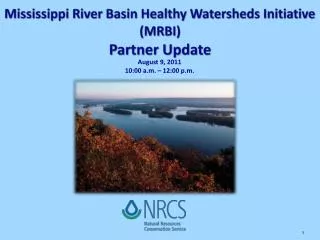
California Healthy Watersheds Assessment. Status Update March 7, 2013. U.S. EPA Healthy Watersheds Initiative. EPA HWI website: www.epa.gov/healthywatersheds Overarching goals of the Initiative: Protect and maintain healthy watersheds, and increase their numbers over time.

E N D
California Healthy Watersheds Assessment Status Update March 7, 2013
U.S. EPA Healthy Watersheds Initiative • EPA HWI website: www.epa.gov/healthywatersheds • Overarching goals of the Initiative: • Protect and maintain healthy watersheds, and increase their numbers over time. • Raise the visibility and importance of protecting high quality waters. • Emphasis is on the protection of: • Landscape connections • Watershed processes and functions
Healthy Watersheds Assessments Methodology Watershed Health Calculate or estimate the indicators for each watershed Select indicators that represent the six attributes of watershed health Create a multimetric index of watershed health Data acquisition and review Establish and prioritize management actions Select indicators that represent watershed vulnerability Calculate or estimate the indicators for each watershed Create a multimetric index of watershed vulnerability Watershed Vulnerability
Project Goals & Objectives • Screening-level assessment to rank watersheds on a statewide basis according to their relative condition as defined by indicators of: • Landscape Condition • Hydrologic Condition • Habitat Condition • Geomorphic Condition • Water Quality • Biological Condition • Combine with a vulnerability assessment to help set management priorities
Timeline • November 2011 – Draft Technical Approach • February 2012 – Initial Selection of Indicators • August 2012 – In-person Project Meeting to Finalize Technical Approach and Selection of Indicators • February 2013 – Draft Results • April 2013 – Draft Report • May 2013 – Final Report and Data Delivery
Outcome from August Meeting • Partnership selected: • Watershed Condition Indicators: • Watershed structural attributes that drive aquatic ecosystem processes and for which spatially continuous landscape-level data are available. • Aquatic Ecosystem Health Indicators: • Aquatic ecosystem attributes for which high quality data representative of the various ecoregions in California are available at discrete sampling locations
Watershed Condition Indicators • Percent Natural Land Cover in the Active River Area • Percent Natural Land Cover in the Watershed • Percent Natural Land Cover in Headwater Areas • Soil Infiltration Capacity • Relative Risk of Excess Sediment Production • Number of Road/Stream Crossings • Dam Storage Ratio • Artificial Drainage
CRAM Wetland Index • Represents habitat condition attribute • Based on California Rapid Assessment Method data.
CRAM Wetland Index • Relative size of red dot represents percent error in predictions at locations with observed data.
CSCI • Represents biological condition attribute • Based on new Combined Stream Condition Index (CSCI)
CSCI • Relative size of red dot represents percent error in predictions at locations with observed data.
Physical Habitat Index • Represents geomorphic condition attribute • Based on current work being conducted by Southern California Coastal Water Research Project
Physical Habitat Index • Relative size of red dot represents percent error in predictions at locations with observed data.
Multimetric Index • Predicted values of each Aquatic Ecosystem Health Indicator were normalized to a scale of 0-1 and averaged together for each of: • Hydrologic Condition • Geomorphic Condition • Water Quality • Habitat Condition • Biological Condition • Similarly, the Watershed Condition Indicators were normalized to a scale of 0-1 and averaged together to obtain a Watershed Condition Index.
Watershed Condition • Percent Natural Land Cover in the Active River Area • Percent Natural Land Cover in the Watershed • Percent Natural Land Cover in Headwater Areas • Soil Infiltration Capacity • Relative Risk of Excess Sediment Production • Number of Road/Stream Crossings • Dam Storage Ratio • Artificial Drainage Area
Hydrologic Condition • Large Flood Flow Alteration • Small Flood Duration Alteration • Small Flood Date Alteration • Small Flood Frequency Alteration • Alteration in Rate of Fall After High Flow Events
Geomorphic Condition • Physical Habitat Multimetric Index
Habitat Condition • California Rapid Assessment Method Index
Water Quality • Temperature • pH • Conductivity • Turbidity • Nitrate
Biological Condition • Combined Stream Condition Index
Aquatic Ecosystem Health • Hydrologic Condition • Geomorphic Condition • Water Quality • Habitat Condition • Biological Condition
Watershed Vulnerability • Climate Change Vulnerability • Projected change in precipitation • Projected change in temperature • Projected change in baseflow • Projected change in monthly snowpack • Projected change in wildfire severity • Projected change in monthly surface runoff • Land Use Vulnerability • Fire Regime Condition Class • Projected Land Cover Change • Water Use Vulnerability • Current Water Demand
Climate Change Vulnerability • Projected change in precipitation • Projected change in temperature • Projected change in baseflow • Projected change in monthly snowpack • Projected change in wildfire severity • Projected change in monthly surface runoff
Land Use Vulnerability • Fire Regime Condition Class • Projected Land Cover Change
Water Use Vulnerability • Current Water Demand
Watershed Vulnerability • Climate Change Vulnerability • Land Use Vulnerability • Water Use Vulnerability
Outcomes from Feb. 14Call with HSP • Identification of thresholds or weights for the various indicators will require a stakeholder process that is not feasible under this project timeline. • Results will be reported at the scale of analysis (135,255 stream reach catchments). This allows for rollup to any larger scale desired. • Desert ecoregion will be evaluated based on watershed condition indicators only.
Next Steps • Refine and finalize modeling. • Produce a draft final report for review by HSP (4/8/2013). • Produce revised final report and deliver data (5/13/2013): • Geodatabase of all input data and model outputs.
Discussion • What are the Council recommendations for presenting the results in the final report and the Healthy Streams Portal?