Download
1 / 17
170 likes | 257 Views
Explore the challenges posed by agriculture on Earth's surface, population growth, and climate change impacts. Discover strategies for decarbonizing the food chain and reducing greenhouse gas emissions from food production and consumption to mitigate environmental damage.

E N D
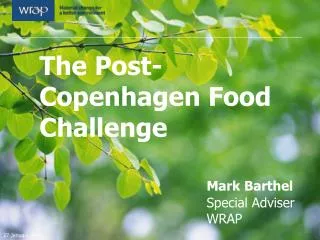
The Post-Copenhagen Food Challenge Mark Barthel Special Adviser WRAP 27 January 2010
Our shrinking Earth: 35% of the Earth’s surface is already used for agriculture – further expansion has serious implications for forests, peat land and biodiversity (a further 20% of grassland and forest land is projected to be converted primarily to agriculture by 2050)
The forecast increase in world population between now and 2050 is more that the total population of the planet in 1950
In the last century the Earth’s average temperature has increased by 0.74C Limiting temperatures to 2C is already too late for some Globally agriculture accounts for 14% of GHG emissions with a further 18% of emissions resulting from land-use change* *Sources: UN FAO (2009) Low Greenhouse Gas Agriculture and UN FAO (2006) Livestock’s Long Shadow: Environmental issues and options
The food chain accounted for an estimated 22%* of UK GHG emissions (160Mt CO2e) in 2006: • Agriculture accounts for 7% of total UK GHG emissions, 37% of methane emissions and 67% of nitrous oxide emissions • Decarbonising the food chain is difficult as GHG emissions are “hardwired” into agricultural systems – technological and behavioural change will be required to deliver substantive emissions reductions *excluding GHG emissions from land use change / 30% of GHG emissions with UK food consumption induced emissions included Sources: Pie chart: Food 2030 – Defra 2010; Bar Chart: Food Matters report – PMSU 2008; WWF-FCRN (2010) How low can we go?
Source: Chapagain & Hoekstra 2004 quoted in IGD Embedded water in food production – 10.09.07 • Global water use for agriculture amounts to around 6,390 billion cubic metres a year including irrigation and soil water • …equivalent to 200,000,000 litres of water a second to grow food.
40% of food harvested in the developing world is lost before consumption due to inadequacies of processing, storage and transport (World Resources Institute) Source: Food Matters report - 2008
India – a case in point Source: Jeff Rees, The Logistics Business – Dec 2009
Waste not, want not? For every tonne of food waste saved, we save 4.2 tonnes of CO2 1 Sources: WRAP estimates and WRAP (2009) Household Food & Drink Waste in the UK
Avoidable food and drink waste is responsible for the equivalent of 20 million tonnes of carbon dioxide equivalent emissions – that’s like taking 25% of cars off of UK roads
Mark Barthel Special Adviser, WRAP Office Tel: 01295 819675 (Amanda Gadd) Mobile: 07950 664501 E-mail: mark.barthel@wrap.org.uk Web: www.lovefoodhatewaste.com www.wrap.org.uk/retail