Download
1 / 21
210 likes | 364 Views
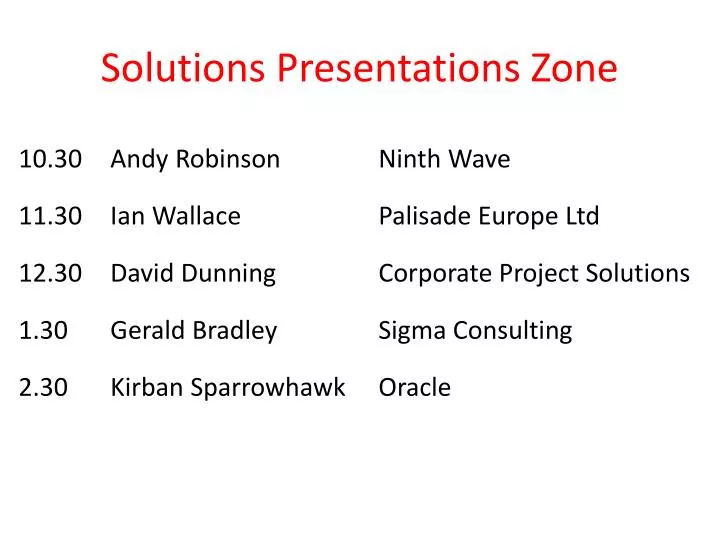
Solutions Presentations Zone. 10.30 Andy Robinson Ninth Wave 11.30 Ian Wallace Palisade Europe Ltd 12.30 David Dunning Corporate Project Solutions 1.30 Gerald Bradley Sigma Consulting 2.30 Kirban Sparrowhawk Oracle . Project Challenge Spring 2009

E N D
Solutions Presentations Zone 10.30 Andy Robinson Ninth Wave 11.30 Ian Wallace Palisade Europe Ltd 12.30 David Dunning Corporate Project Solutions 1.30 Gerald Bradley Sigma Consulting 2.30 Kirban Sparrowhawk Oracle
Project Challenge Spring 2009 Do you feel confident? Using Monte Carlo probability analysis in project management 7 June 2014 Presenter: Ian Wallace
Measuring confidence Only 70% chance of being on-time!
Monte Carlo distribution Statistics, shape/skew, percentiles, estimate of probability of meeting base case or target value. Expected Value/Mean ML Min Max 10 0 20 30 40 50 60 70 90% chance
Benefits • Corporate benefits • Reduces over-commitments to customers • Robust process • Improved transparency/reduced budget-padding & WIP • Better risk management & competitive edge • Good corporate governance practice • Personal benefits • Helps gets the right amount of resources/best plan • Less work than MS Project’s PERT analysis • Manages expectations • Good professional practice – PMP/PRINCE • Improves the chances of success • Excellent communication tool
Triangular Distribution
PERT Distribution
Uniform Distribution
Typical pitfalls • GIGO • Weighting opinions/bias • Training/getting used to the jargon • Level of detail
Positioning the process Risk register Qualitative Quantitative Data collection Graphing & analysis Including risk events Tracking & control
Immediate benefits • Is this a good project plan? • What are the chances of success? • Have we got enough contingency? • What are the most important risks?
Wider benefits • Corporate benefits • Reduces over-commitments to customers • Robust process • Improved transparency/reduced budget-padding & WIP • Better risk management & competitive edge • Good corporate governance practice • Personal benefits • Helps gets the right amount of resources/best plan • Less work than MS Project’s PERT analysis • Manages expectations • Good professional practice – PMP/PRINCE • Improves the chances of success • Excellent communication tool
Conclusion Good ‘Luck’!