LINEAR GRAPHS
LINEAR GRAPHS. 2D Graphs. - Show how two quantities relate. - Have labelled axes, usually with scales showing units. e.g. Height (m). Tom. Jane. Bob. Mary. Age (years). a) Who is the tallest?. Tom. b) Who is the same age?. Bob and Mary. c) Who is the oldest?. Jane.

LINEAR GRAPHS
E N D
Presentation Transcript
2D Graphs - Show how two quantities relate - Have labelled axes, usually with scales showing units e.g. Height (m) Tom Jane Bob Mary Age (years) a) Who is the tallest? Tom b) Who is the same age? Bob and Mary c) Who is the oldest? Jane
Distance/Time Graphs - Are line graphs with time on the horizontal and distance on the vertical axis. - If the line is horizontal the object is not moving - The steeper the line, the faster the movement e.g. Steepest a) How far out from the harbour did the yacht travel? 5 km b) What happened while the graph was horizontal? The yacht was stationary c) Which part of the journey was quickest? The return journey
Co-ordinates - The first number relates to the horizontal axis (x) - The second number relates to the vertical axis (y) e.g. Plot the following points A = (4,2) and B = (ˉ3,ˉ4) A B Remember to always label your x and y axis!
Plotting Points - To draw straight line graphs we can use a rule to find and plot co-ordinates e.g. Complete the tables below to find co-ordinates in order to plot the following straight lines: a) y = 2x b) y = ½x – 1 c) y = -3x + 2 2 x -2 -4 ½ x -2 – 1 -2 2 x -1 -2 ½ x -1 – 1 -1 ½ 0 -1 2 -½ 4 0 -3 x -2 + 2 8 -3 x -1 + 2 5 2 -1 -4
Gradients of Lines - The gradient is a number that tells us how steep a line is. - The formula for gradient is: Gradient = rise run When calculating gradients it is best to write as simplest fraction e.g. Write the gradients of lines A and B e.g. Draw lines with the following gradients a) 1 b) 3 c) 2 25 = 3 1 4 6 8 4 4 = 1 8 2 6 = 3 4 2 A = B = To draw, write gradients as fractions
y = mx • This is a rule for a straight line, where the gradient (m) is the number • directly in front of the x • When drawing graphs of the form y = mx, the line always goes through the • origin i.e. (0,0) e.g. Draw the following lines: a) y = 2x b) y = 4x c) y = 3x 54 = 4x 1 gradient 1. Step off the gradient from the origin (0,0) 2. Join the plotted point back to the origin To draw, always write gradients as fractions
Negative Gradients e.g. Write the gradients of lines A and B -3 -5 2 10 A = -5 = -1 10 2 B = -3 2 When calculating gradients it is best to write as simplest fraction
e.g. Draw the following lines: a) y = -2x b) y = -4x c) y = -3x 54 = -4x 1 gradient 1. Step off the gradient from the origin (0,0) 2. Join the plotted point back to the origin To draw, always write gradients as fractions
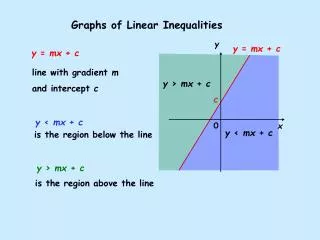
Intercepts - Is a number telling us where a line crosses the y-axis (vertical axis) i.e. The line y = mx + chas m as the gradient and c as the intercept e.g. Write the intercepts of the lines A, B and C A = 8 B = 4 C = -3
Drawing Lines: Gradient and Intercept Method - A straight line can be expressed using the rule y = mx + c e.g. Draw the following lines: a) y = 1x + 2 b) y = -3x – 2 c) y = -4x + 8 2 7 = -3x – 2 1 To draw: 1. Mark in intercept 2. Step off gradient 3. Join up points Note: Any rule with no number in front of x has a gradient of 1 1 e.g. y = x – 1
Writing Equations of Lines - A straight line can be expressed using the rule y = mx + c e.g. Write equations for the following lines 3 4 -2 3 4 1 A: m = c = -6 B: m = c = +1 C: m = c = +4 y = -2x + 1 3 y = 4x + 4 1 y = 3x – 6 4
Horizontal and Vertical Lines - Horizontal lines have a gradient of: 0 Rule: y = c (c is the y-axis intercept) - Vertical lines have a gradient that is: undefined Rule: x = c (c is the x-axis intercept) e.g. Draw or write equations for the following lines: a) y = 2 b) c) x = 4 d) y = -3 x = -1 b) d)
Writing Equations Cont. When you are given two points and are expected to write an equation: - One method is set up a set of axes and plot the two points. - Or, substitute the gradient and a point into y = mx + c to find ‘c’, the intercept e.g. Write an equation for the line joining the points A=(1, 3) and B = (3, -1) -2 1 m = c = 5 y = -2x + 5 -2 1 m = using point (1, 3) y = mx+ c 3= -2 x 1 + c 3= -2 + c +2 +2 5= c y = -2x + 5 Sometimes when plotting the points, you may need to extend the axes to find the intercept.
Equations in the Form ‘ax + by = c’ - Can use the cover up rule to find the two intercepts: e.g. Draw the following lines: a) 2y – x = 4 b) 4x – 3y =12 - x = 4 2y = 4 4x = 12 -3y = 12 ÷ -1 ÷ -1 ÷ 2 ÷ 2 ÷ 4 ÷ 4 ÷ -3 ÷ -3 x = -4 y = 2 x = 3 y = -4 1. Cover up ‘y’ term to find x intercept 2. Cover up ‘x’ term to find y intercept 3. Join up intercepts with a straight line It is also possible to rearrange equations into the form y = mx + c e.g. Rearrange 2x – y = 6 -2x -2x - y = 6 – 2x ÷ -1 ÷ -1 y = -6 + 2x y = 2x – 6
Applications e.g. A pizzeria specializes in selling large size pizzas. The relationship between x, number of pizzas sold daily, and y, the daily costs is given by the equation, y = 10x + 50 1. Draw a graph of the equation 2. What are the costs if they sell 8 pizzas? $130 3a. What is the cost per pizza? $10 3b. How is this shown by the graph? The gradient of the line 4a. What are the costs if they sell no pizzas? $50 4b. How is this shown by the graph? Where the line crosses the y-axis