Download
1 / 68
680 likes | 900 Views
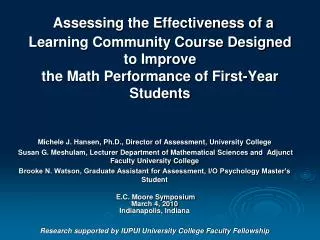
Understanding Student Success and Retention . Presented by Michele J. Hansen, Ph.D., Director of UC Assessment November 20, 2008 CRG Steering Committee Meeting . Presentation Overview . Student Progress and Academic Success Highlights of Research on Impacts of UC Programs

E N D
Understanding Student Success and Retention Presented by Michele J. Hansen, Ph.D., Director of UC Assessment November 20, 2008 CRG Steering Committee Meeting
Presentation Overview • Student Progress and Academic Success • Highlights of Research on Impacts of UC Programs • First-Year Seminars • Themed Learning Communities • Summer Bridge • Critical Inquiry • Factors Associated with Academic Success • 2008 First-Time, Full-Time Cohort (Indianapolis Only)
IUPUI (Indianapolis Only) Retention Trend Lines Source: IMIR UC 10-Year Celebration Report.
FT Beginners GPAs and Retention Rates Source: University Reporting & Research: official reports are available at http://www.indiana.edu/~urr
Approaches to Assessing First-Year Programs • Use assessment to prove and improve programs: summative and formative evaluation. • Employ multiple measures of student learning and academic success - moving beyond retention. • Use program evaluation methodology: understanding needs, processes, and learning outcomes. • Understand the dialogue between qualitative and quantitative research. • Seek involvement of key stakeholders in assessment planning, implementation, and deployment. • Ensure information used for program improvement. • Meta-Assessment
Focus on Accountability • Four-Year Graduation Rates • Degree Completion • Course Completion • “Value-Added” Interventions • Cost-Effectiveness • Student Learning Outcomes
Complexity of Retention • Pre-College Factors and Preparation • Background Characteristics • Students’ Intentions • Students’ Expectations • Students’ Needs • Students’ Financial Issues • Institutional Factors • External Environmental Factors
Fall 2007 Impact of Participation in a First-Year Seminar on One-Year Retention
Hierarchical Logistic Regression: 2007 First-Year Seminar and Retention
Other Indicators of Academic Success: 2007 First-Year Seminars • 30% of the non-participants earned a grade point average below a 2.0 compared to 23% of participants. • The DWF rate for non-participants (29%) was notably higher compared to participants (23%). • The IUPUI fall-to-spring retention rate for non-participants was 83% compared to 87% for participants.
309 Non-Participants No significant differences in hours expected to work off-campus, studying, or care for dependents! Participants expect to work significantly more hours on-campus.
Impact of Participation in a 2007 First-Year Seminar: One-Year Retention
Fall 2007 Impact of Participation in a First-Year Seminar on One-Year Retention
Students’ Reported Notable Improvements and Course Benefits in the Following Areas… • Making connections with other students, peer mentors, faculty, and advisors. • Academic advising (e.g., knowledgeable, available when needed assistance). • Experiencing environment that promotes and respects diversity. • Becoming familiar with campus and academic support resources. • Deciding on a major or future career. • Adjusting to college.
Most Valued Aspects of Leaning Communities • Making connections and forming a sense of community. • Learning more about IUPUI campus and academic support resources. • Exploring majors and career opportunities. • Learning about library resources.
Least Valued Aspects of Leaning Communities • Assignments that do not contribute to learning process: “busy work.” • Unorganized activities in and outside of class. • Class activities that are not linked with discipline courses. • Class activities that are not related to major or career goals.
National Survey of Student Engagement Significant differences of FYS students in comparison to others: Students participating in FYS • made more class presentations. • worked with students outside of class more often. • participated in more community-based projects. • Included diverse perspectives in class discussions or writing assignments. FYS students also reported • Better quality of academic advising. • experiencing a more supportive campus environment. • engaging in more active and collaborative learning.
TLC First Semester G.P.A. Comparison group – students who participated in a freshman seminar or learning community. *G.P.A. adjusted to control for significant covariates including: course load, gender, ethnicity, SAT scores, high school percentile ranks, units of high school math, and first-generation students. Bolded items are significant p<.01
TLC Retention Fall 2004 One Year Retention # of Students Retention Rate* TLC Participants 28769% Non-TLC Participants 1351 68% Fall 2005 One Year Retention # of StudentsRetention Rate* TLC Participants 338 70% Non-TLC Participants 1211 65% Fall 2006 One Year Retention # of StudentsRetention Rate* TLC Participants 37770% Non-TLC Participants 1779 67% Fall 2007 One Year Retention # of Students Retention Rate* TLC Participants 565 76% Non-TLC Participants 1690 67% Comparison group – students who participated in a freshman seminar or learning community. *Bolded items are significant p<.05, even while controlling for differences in demographics, enrollment, and academic preparation.
National Survey of Student Engagement Significant differences between TLC students (80) in comparison to others (280): Students participating in TLCs more often: • Worked on a paper or project that required integrating ideas or information from various sources. • Made more class presentations. • Included diverse perspectives (different races, religions, genders, political beliefs, etc.) in class discussions or writing assignments. • Put together ideas or concepts from different courses when completing assignments or during class discussions . • Worked harder than thought they could to meet an instructor's standards or expectations. • Tried to better understand someone else's views by imagining how an issue looks from his or her perspective. • Learned something that changed the way you understand an issue or concept.
National Survey of Student Engagement TLC students also reported more institutional emphasis on: • Providing the support needed to help students succeed academically • Encouraging contact among students from different economic, social, and racial or ethnic backgrounds • Helping students cope with non-academic responsibilities (work, family, etc.) • Working effectively with others • Understanding people of other racial and ethnic backgrounds
Academic Performance of TLC Students Compared to Students in Same School or Discipline Seminar
Essential Elements Of Summer Bridge • Offered as a two-week program for incoming freshmen held in August before fall classes begin • Open to students in specific majors • Based on student interest in pursuing a particular major or in exploring various major options • Provides a collegiate-level curriculum • Creates communities of entering students • Offered free to participants • Required for all First Generation Scholarship award winners beginning fall 2006
Characteristics of 2005 Cohort • 175 Students Participated • 70% Women • 9% African American • 53% First-Generation College Student • 18% First-Generation Scholars • 22% Admitted Conditionally • 1016 Average SAT Score • 69% Average High School Percentile Rank • 39% Campus Housing • 18-19 Primary Ages. Average=18.17
Characteristics of Fall 2006 Two-Week Cohort • 209 Students Participated • 71% Women • 8% African American • 89% First-Generation College Student • 70% First-Generation Scholars • 7% Admitted Conditionally • 1000 Average SAT Score • 75% Average High School Percentile Rank • 27% Campus Housing • 18-19 Primary Ages. Average=18.75
Characteristics of Fall 2007 Two-Week Cohort • 361 Students Participated • 72% Women • 7% African American • 91% First-Generation College Student • 78% First-Generation Scholars • 10% Admitted Conditionally • 982 Average SAT Score • 3.31 Average High School GPA • 34% Campus Housing • 18-19 Primary Ages. Average=18.77
Two-Week Summer Bridge Participants Compared to Non-Bridge Participants: Conditional Admits
Summer Bridge Participants Compared to Non-Bridge Participants: First-Generation Scholars
2007 Bridge-Themed Learning Community Combination has Positive Effects
Hierarchical Multiple Regression: 2007 Two Week Summer Bridge and GPA
First-Time, Full-Time Eligible for the 21st. Century Scholarship Bridge Participants vs. Cohort Non-Participants
Factors that Significantly Predict Overall Satisfaction with Summer Bridge • College Adjustment • Course Activities • Campus Resources • Interactions with Instructional Team Members adjusted R2 =.215, F (9, 756)=23.97, p<.0001).
Summer Bridge (Two-Week)Student Questionnaire Results 98% of 2008 students surveyed (n=414) said they would recommend the Summer Bridge program to other first-year students. 2007 = 98% 2006 = 99% 2005 = 96%, 2004 = 98%
Spring 2008 Impact of Participation in a Critical Inquiry Course for Conditional Admits
Spring 2008 Impact of Participation in a Critical Inquiry Course for Conditional Admits
Factors That Threaten Persistence and Graduation from College • Academically underprepared for college-level work • First-generation college student • Gap between high school and college • 30+ hours working per week • Part-time enrollment • Single parent • Financially independent • Children at home • Lack of institutional and goal commitment • George Kuh, 2006
Factors Associated with Success (Source: Gary Pike Presentation 4/19/07) • Gender • First-Generation Student • Institutional Commitment (Intent to Transfer) • Amount of Time Spent Working • Student Groups (predicted GPAs based on SAT/ACT & High School GPA) Ethnicity (minority status) was not significantly related to student success.
IUPUI Factors Related to Academic Success • Levels of Academic Hope. • The process of thinking about one’s goals, along with the motivation to move toward those goals (agency) and the strategies to achieve those goals (pathways). • Comprehension and completion of assignments during the last year of high school. • Participating in First-Year Seminars, Thematic Learning Communities, and Summer Bridge (early interventions).
Summary of Major Changes • ICHE Accountability and Outcomes Focus: degree completion, on-time graduation, value-added experiences. • More academically prepared students. • More International and Out-of-State students. • More students entering just out of high school: 18-19 years of age. • More students living on-campus. • Improved retention and graduation rates. Retention not likely to exceed 80% in next 5 years.
Factors to Consider • Many students have not completed a rigorous high school college-preparatory curriculum (23% of 2007 FT, FT students earned below a 2.0 GPA during their first semester). • Difficult for students to make the necessary connections with other students and faculty. • First generation students may benefit from support/mentoring to help bolster academic performance. • Notable percentage of African American students are first generation college students (70%). • Students seem to have unrealistic expectations about their expected levels of academic performance and time they should be devoting to studying. • Continue investigations of what interventions produce the best educational outcomes and take into account diverse students’ needs.