Download
1 / 24
240 likes | 343 Views
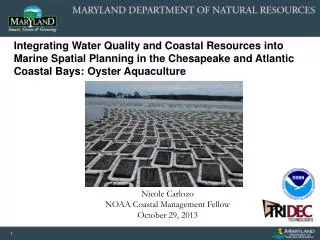
Oyster Aquaculture Expansion in Maryland’s Chesapeake Bay: Informing industry opportunities and conflicts through GIS and participatory mapping processes. Nicole Carlozo NOAA Social Coast Forum Charleston, SC February 18, 2014. Saving Maryland’s Oyster. Why do we care?. State Actions.

E N D
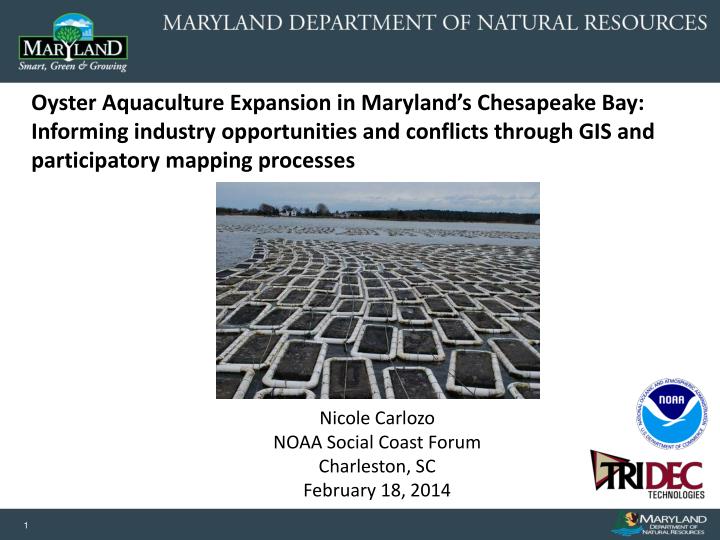
Oyster Aquaculture Expansion in Maryland’s Chesapeake Bay: Informing industry opportunities and conflicts through GIS and participatory mapping processes Nicole Carlozo NOAA Social Coast Forum Charleston, SC February 18, 2014
Saving Maryland’s Oyster Why do we care? State Actions Oyster Aquaculture Planning Data Portals (DNR Aquaculture Division) Suitability Modeling (NOAA Fellow/MD DNR) Addressing user-conflicts and needs through stakeholder participation (NOAA Fellow/ MD DNR)
The eastern oyster (Crassostrea virginica)… A Heritage in Oysters:Crisfield, Cambridge, Oxford, St. Michaels, Galesville, Solomons, Smith Island… Oyster Police cannon Photos courtesy of MD Historical Society, MD DNR, National Archives
The Declining Fishery 1949. Dermo 1959. MSX Dermo MSX Source: NOAA Chesapeake Bay Office “In ten or fifteen years the oyster men of Chesapeake Bay will be extinct, and their unique maritime culture and independent way of living will pass into folklore and history…” (Wennersten, 1981)
Taking Action • Habitat protection/sanctuaries • Artificial reefs • Large-scale restoration • 20 tributaries by 2025 • Enforcement • Promote Aquaculture (1820, 1965, 1906…2010) • Oyster Restoration and Aquaculture Development Plan • Data collection and transparency
Marine Spatial Planning* * Data sharing, transparency, data collection, tool development, stakeholder participation, use-conflicts, coastal planning Oyster Aquaculture Planning Data Portals (Online Aquaculture Siting Tool) Suitability Modeling (GIS Model) Addressing user-conflicts and needs through stakeholder participation (Participatory GIS)
Aquaculture Policy: Exclusion areas • SAV zone (5 years) • Oyster Planting Areas (6 years) • Closed Harvest Areas • Public Shellfish Fishery Area (150 ft buffer) • Harvest Reserve Area (150 ft buffer) • Pound net sites (150 ft buffer) • Yates bars within sanctuaries (150 ft buffer) • Federal navigation channels (150 ft buffer) • Navigation buoys (250 ft buffer) – requires Army Corps of Engineers / Coast Guard Review • Shoreline (50 ft buffer, unless landowner permission) • Blind spots (500 yard buffer) – locations change annually • MD artificial reef initiative sites • Current shellfish leases • Potomac River main stem • No more than 10% of any sanctuary can be leased (leases must be compatible with restoration).
1) Identify high priority aquaculture areas that align with TMDL water quality goals. 2) Investigate oyster aquaculture as a BMP to meet Chesapeake TMDL water quality goals. 3) Develop recommendations about the best ways to balance competing coastal uses.
1) Identify high priority aquaculture areas that align with TMDL water quality goals. • Develop Suitability Parameters • Bottom, Caged, and Floating Aquaculture • Interviews • Literature Research • Expert facilitation Develop GIS Model Environmental Parameters: DO, Salinity, Temp, Bottom Substrate, Bacteria Policy Parameters: Online Aquaculture Siting Tool, Cultural/Historic Sites Additional Parameters: Bathymetry
Oyster Aquaculture Suitability Model Models: • Bottom, Caged, Floating • Raster Calculator: • Suitable = 1 • Unsuitable = 0 DO Temperature Salinity Bottom Policy Bacteria Bathymetry
Priority Areas NOTE: Fetch, wave action, chlorophyll, and flow were not incorporated into this initial model. • Long-term survival, optimal filtration • Reduced disease risk • Ability to harvest • Suitable substrate for reduced maintenance
2) Investigate oyster aquaculture as a BMP to meet Chesapeake TMDL water quality goals. • Average N content: 8.2% of tissue dry weight (DW) and 0.21% of shell DW. • Average P content: 1.07% of tissue DW and 0.06% of shell DW. • (2013 STAC Report) Source: NOAA Chesapeake Bay Office/EcoCheck
3) Develop recommendations about the best ways to balance competing coastal uses. Participatory Mapping (pGIS) “Gathering and mapping spatial information to help communities learn, discuss, build consensus, and make decisions about their communities and associated resources.” (NOAA Coastal Services Center 2009)
Inform land acquisition / recreation planning, public access needs, and future oyster aquaculture expansion. Identify current use patterns to determine future needs or potential conflicts. Reduce information gap Integrate CMSP into management efforts. 24 recreational use categories Charter/Guided Fishing/Hunting General Cultural/Historic Uses 3 Breakout rooms +40 participants 8 to 10 staff E-beam (electronic pen) Participatory Mapping Workshop Purpose
Stakeholder Participation Draw on local experts to obtain knowledge about recreational uses: • location (spatial range) • intensity (general vs. dominant) • other use characteristics (seasonality) Workshop facilitators & mapping specialists help convert local knowledge into readable maps Use interactive mapping software to explain… “What happens where?” “To what extent?”
Data Collection General Use Footprint : Areas in which the use is known to occur with some regularity (over the past 3‐5 years), regardless of its frequency or intensity. Dominant Use Areas: Areas routinely used by most users most of the time (within the seasonal patterns for that use).
Putting the Pieces Together… Next Steps • Suitability Model: HAB risk areas; Climate risk areas; refine as needed. • Develop workshop materials for Chesapeake-wide PGIS workshops. • Engage state/local resource and recreation planners. • Data sharing (Coastal Atlas).
Thank You! Nicole Carlozo ncarlozo@dnr.state.md.us
State of Aquaculture • 10 Point Oyster Restoration Plan • Focus on targeted restoration strategies • Expand the sanctuary program • Support a more targeted and scientifically managed wild oyster fishery • Shift commercial production to aquaculture • Rehabilitate oyster bar habitat • Manage against oyster disease • Increase hatchery production • Enhance law enforcement • Increase citizen involvement • Integrate inmate labor • 338 leases • 11 of 16 coastal counties
Taking Action: Aquaculture Planning • 2010: Oyster Restoration and Aquaculture Development Plan • Publish Shellfish Fishery Areas • Aquaculture Enterprise Zones • Expand Sanctuaries • Update lease law (reflected within Online Aquaculture Siting Tool) • 10 Point Oyster Restoration Plan
Data Processing Develop & present preliminary map productsto participants and experts for review. Follow-up with local experts as needed to gain a more in-depth understanding of use patterns. Revise and share data. Fishnet Cells