Download
1 / 26
280 likes | 535 Views
Design and Analysis of Clinical Study 3. Reliability and Validity. Dr. Tuan V. Nguyen Garvan Institute of Medical Research Sydney, Australia. Overview. Some concepts of measurement Methods for assessment of reliability Flawed methods Consequences of measurement error

E N D
Design and Analysis of Clinical Study 3. Reliability and Validity Dr. Tuan V. Nguyen Garvan Institute of Medical Research Sydney, Australia
Overview • Some concepts of measurement • Methods for assessment of reliability • Flawed methods • Consequences of measurement error • Control of measurement error • Summary
Three Concepts about Science Classificatory – Phân loại place objects within a certain class Comparative – So sánh relationships between objects (warmer/cooler) Prediction – Tiên đoán evolution from the comparative concept
Theoretical vs Empirical Level Theoretical level Empirical level Latent construct: tasteless, anxiety, intelligence, bone strength, etc. Observed indicator: test score, measured values.
Measurements • The assigning of numbers to the values of a variable (SS Stevens, Science 1946;103:677-80) • Rules specify procedures to assign numbers to values Qualitative (định chất) Quantitative (định lượng) Nominal (danh) Interval (khoảng) Ordinal (thứ tự) Ratio (tỉ số)
Nominal level Classification A set of objects can be classified into exhaustive, mutually exclusive and unique symbol Ex: religion, sex, location, etc Qualitative Measurements Ordinal level • Classification + Ordering • A set of numbers can be assigned rank values and nothing more. • Ex: socio-economic status, education, levels of satisfaction, bitterness, etc
Interval level Classification + Ordering + Standard distance A set of objects can be described by units that indicate how far one case is from another case Ex: temperature Quantitative Measurements Ratio level • Classification + Ordering + Standard distance + Natural zero • Quantitative variable with natural zero • Ex: income, age, weight, bone mineral density
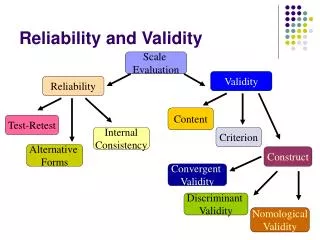
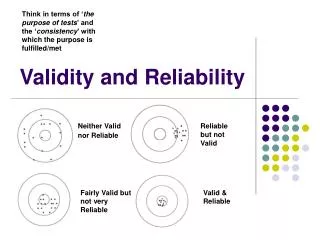
Criteria of Measurements • Validity measures what it purports to • Accuracy - the degree of “truthfulness” of an attribute that is being measured. • Reliability (consistency and repeatability) • Sensitivity to important variation
Accuracy vs Reliability (Precision) precision accuracy Measurement error decreases the accuracy of measurement
Reliability Reliability (repeatability, reproducibility) • Stability. Degree of stability exhibited when a measurement is repeated under identical conditions • Equivalence. Same results by different operators
Validity Validity (validus = strong) • Constructive validity. The extent to which the measurement corresponds to theoretical concepts (constructs). Ex: Bone density changes with advancing age. • Content/Face validity. The extent to which the measurement incorporates the domain of the phenomenon under study. Ex: functional health status should encompass activities of daily living, occupation, family, etc. • Criterion validity. The extent to which the measurement correlates with an external criterion of the phenomenon under study. Ex: academic aptitude test is validated against subsequent academic performance.
Statistical Indices of Reliability Quantitative Qualitative • Standard error of measurement (độ sai chuẩn) • Coefficient of variation (hệ số biến thiên) • Coefficient of reliability (hệ số tin cậy) • Coefficient of concordance (hệ số đồng hợp) • Limit of agreement (giới hạn đồng nhất) • Kappa statistic • Cronbach’s alpha coefficient • Coefficient of concordance • Intraclass correlation coefficient (hệ số phương sai trong một đối tượng)
Assessment of Reliability: Quantitative Measurements General case Measurement Patient 1 2 . . . . k 1 x11 x12 . . . x1k 2 x21 x22 . . . x2k 3 x31 x32 . . . x3k . . . Nxn1 xn2 . . . Xnk Bone mineral density (mg/cm2) Patient First Second 1 117 118 2 115 118 3 110 108 4 91 93 5 138 138 6 85 90 7 107 109 8 110 108 9 98 95 10 105 109
Plot of 1st and 2nd Measurements First measurement
Estimation of Reliability: Quantitative Measurements Bone mineral density Patient First Second Mean Variance 1 117 118 117.5 0.5 2 115 118 116.5 4.5 3 110 108 109.0 2.0 4 91 93 92.0 2.0 5 138 138 138.0 0.0 6 85 90 87.5 12.5 7 107 109 108.0 2.0 8 110 108 109.0 2.0 9 98 95 96.5 4.5 10 105 109 107.0 8.0 Mean 107.6 108.6 108.1 3.8
Standard Error of Measurement (SEM) Interpretation: The difference between a subject’s measurement and the “true” value would be expected to be less than 1.96x1.95 = 3.8 for 95% of observations. n = number of subjects si2 = intra-subject variances
Coefficient of Variation (CV) Let Xbe the overall mean, and S be the within-subject standard deviation. In our case: X = 108.1, S = sqrt(3.8) = 1.95 Coefficient of variation CV = S / X = 1.95 / 108.1 = 1.8%
Coefficient of Variation (CV): Interpretation CV = 1.8% • All variability between repeated measurements within a subject is 1.8%? • Assuming Normality: • 68% of the differences between measurements lie within 1.8% of the mean; • 95% of the differences between measurements lie within 1.8x2 = 3.6% of the mean
Limits of Agreement (LoA) Assumption: Individual differences are Normally distributed. Concept: The variability of reproducibility (intrasubject difference) for individual subjects may be expressed as 95% CI of the difference. LoA =
Limit of Agreement: estimation Bone mineral density Patient First Second Difference 1 117 118 -1 2 115 118 -3 3 110 108 +2 4 91 93 -2 5 138 138 0 6 85 90 -5 7 107 109 -2 8 110 108 +2 9 98 95 +3 10 105 109 -4 Mean 107.6 108.6 -1 SD 14.8 14.2 2.7 LoA = -1 + 1.96(2.7) = -6.3 to +4.3 The repeated BMD measurements may be 6.3 below or 4.3 above an average value for a subject.
Blamd-Altman Plot Mean of 2 measurements
Measure of Reliability for Qualitative Data • Two doctors’ assessment of severity of vertebral deformity (X-ray) • The scores are categorical: none, mild and severe. • The outcomes may be summarized as follows:
Kappa statistic • Proportion of agreement: • Proportion of change agreement: • Kappa statistic • Variance of k
Kappa: Example of Analysis • Proportion of agreement: PA = (302+55+18)/466 = 0.805 • Proportion of change agreement: PC = 0.575 • Kappa statistic: k = 0.54 • Variance of k: 0.00161 • Standard error of k: sqrt(0.00161) = 0.04 • 95% confidence interval of k : 0.54 ± 2(0.04) = 0.46 to 0.62
Summary • Reliability (reproducibility, repeatability) is different from accuracy (validity) concept. • Analysis of reliability for continuous measurements: coefficient of reliability, coefficient of variation, limit of agreement. • Analysis of reliability for categorical measurements: Kappa statistic.