Download
1 / 16
160 likes | 224 Views
Emissions by Household Type. Anne Jennings, Sean Lyons & Richard S.J. Tol Economic and Social Research Institute, Dublin Vrije Universiteit, Amsterdam Trinity College, Dublin. Introduction. Different households behave differently and thus exert different pressure on the environment

E N D
Emissions by Household Type Anne Jennings, Sean Lyons & Richard S.J. Tol Economic and Social Research Institute, Dublin Vrije Universiteit, Amsterdam Trinity College, Dublin
Introduction • Different households behave differently and thus exert different pressure on the environment • Part of that is random / due to unobserved characteristics, but there is also systematic variation with household type • Understanding these patterns helps to improve projections of future emissions and to assess the distributional implications of environmental policy
Method and data: Direct emissions • Energy use by fuel from Household Budget Survey • Emission coefficients from SEAI or DEFRA • No correction for type, age, or state of equipment (as no data)
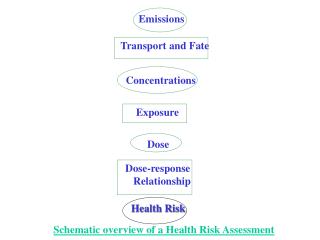
Method: Indirect emissions • Standard input output model X = (I-A)-1y = Ly • Emissions M = RX = RLy • Decomposition of final demand y = y(1) + y(2) + … + y(n) • Decomposition of emissions M = M(1) + M(2) + … + M(n) = RLy(1) + RLy(2) + … + RLy(n)
Data: Indirect emissions • Input-output tables: CSO • Emissions: ESRI (derived from CSO, EPA, SEAI) • Consumer demand by household type: CSO
Benzo(b)fluoranthene (air) Nitrogen oxides (air) Income Hexachlorobenzene (water) Volatile organic compounds (air)
Volatile organic compounds (air) Nitrogen oxides (air) Size Dioxins (water) Polychlorinated biphenyl (land)
Conclusions • We imputed direct and indirect emissions by household type • There are marked patterns in both direct and indirect emissions • Different patterns between direct and indirect emissions • Similar patters for different substances, but details can be very different • The impact of environmental policy is differentiated between households