Download
1 / 21
210 likes | 317 Views
Study on the search for high-mass dilepton resonances in pp collisions at √s = 7 TeV using the ATLAS experiment, including theoretical introduction, data analysis, and limits on Z' boson.

E N D
Discovery potential of the Z´ boson with the 2010 ATLAS data Ariadni Antonaki Dimitris Fassouliotis Christine Kourkoumelis University of Athens XXIX Workshop on Recent Advances in Particle Physics and Cosmology 14-16 April 2011, University of Patras, Greece
This work is part of “Search for high mass dilepton resonances in pp collisions at sqrt{s} = 7 TeV with the ATLAS experiment” The ATLAS Collaboration arXiv:1103.6218v1 [hep-ex] 31 Mar 2011
Outline Theoretical Introduction 2010 ATLAS data Monte Carlo Signal and Backgrounds Analysis Limits on Z’ ATLAS
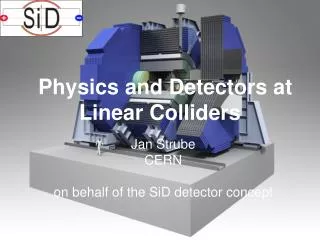
ATLAS Muon Spectrometer 4 types of Chambers, 2 categories: Precision / Trigger figure from ATLAS Muon Spectrometer TDR • University of Athens (UoA) 30000 BIS MDT tubes assembly • National Technical University of Athens (NTUA) Quality Assurance/Quality Control of MDT tubes • Aristotle University of Thessaloniki (AUTh) MDT chamber assembly
Theoretical Introduction • Several theoretical models beyond SM predict the existence of new, heavy, gauge bosons at the TeV scale • GUTs • E6 models • Left-Right Symmetric models • Little Higgsmodels • Kaluza-Kleinmodels • Two types of such bosons: Z’ (neutral) / W’ (charged) • The present search is based on the Sequential Standard Model (SSM) Z’is considered identical to Z (same couplingsto fermions) but with much larger mass. • The mass is a free parameter in the theory. • Limits from Tevatron: ~1TeV • We are working with final states to muons:Ζ’μ+μ-
2010 ATLAS data We have used the total amount of 2010 ATLAS p-p data @7TeV, that corresponds to an integrated luminosity of ~42pb-1.
Signal and Background procedures Signal Z’ μ+μ-(Pythia) @ several mass samples *** Background Procedures with two oppositely charged muons in the final state
ANALYSIS: Event & Muon Selection * recon. by ID & MS
ANALYSIS: # of events, after all cuts (BKG normalized to Data events in Z pole) Total cosmic background (M>70GeV): 0.004 ± 0.002
ANALYSIS: Dimuon Masses, after all cuts arXiv:1103.6218v1 Mμ+μ- = 768GeV
ANALYSIS: Event @ 768GeV PT1: 186 GeV / (η,φ) : (-2.39, -1.54) PT2: 135 GeV / (η,φ) : (0.46, 1.95) p-value: The probability, in the absence of signal, of observing an excess in a particular mass For 768GeV: ~ 22% (probability 22% to get ONE event in 768GeV, if Z’ DOES NOT exist If p<5%, we wouldn’t be able to put limits) Therefore, NOstatistically significant excess above the predictions of the SM is observed.
ANALYSIS: Limits From BKG pseudoexperiments From DATA arXiv:1103.6218v1
SUMMARY We have searched for high-mass Z’ boson resonances using the total amount of 2010 ATLAS data. The invariant mass distribution is well-described by the estimated background - We found no excess at high mass in the data. We have set limits on the cross section for Z’ boson production, as well as limits on its mass (0.297 pb - 0.834TeV) Combined limits (using μ+μ- & e+e- channel): Mass : 1.048TeV / σ Β = 0.094pb Limits from CMS: 1.14TeV (arXiv: 1103.0981v2)
Analysis Cuts Good Run List (GRL): to ensure that relevant parts of the detector were operational, several Data Quality flags: Muon Detector, Inner Detector, Trigger, Muon Reconstruction//exclusion of problematic Luminosity Blocks. Trigger: Single muon triggers were used // rejection of low-PT physics procedures (different for the several data runs: adjusted to increasing lumi – common for all MC samples) Primary Vertex: The event is required to have a primary vertex in z0<200mm form I.P., with at least three tracks associated to it //ensures a p-p collision • Inner Detector Hits: • expectBLayer=false OR numberOfBLayerHits >= 1 • Pixel Hits + Crossed Dead Pixel Sectors >= 2 • SCT Hits + Crossed Dead SCT sensors >= 6 • Pixel Holes + SCT Holes <= 1 • Restrictions on TRT Outliers (hits close to a track, but not associated to it) • Muon Spectrometer Hits: • Inner, Middle, Outer MDT/CSC layers: at least 3 hits in each • MS φ hits > 0 • BEE, EE, BIS78 vetoed (misaligned chambers)
Pile Up - Reweighting We use Pile Up Monte Carlo samples (most representative of the bulk of the data). Correlated Observable: Number of Primary Vertices We calculate the number of Primary Vertices in the Z sample and normalize it to the data EVENT WEIGHT arXiv:1103.6218v1 BEFORE reweighting AFTER reweighting
QCD Bkg estimation A simulated QCD sample (b \bar{b} & c \bar{c} ), after all selection cuts EXCEPT isolation, is normalized to the data in the region ΣPT (cone 0.3) / PT > 10% (“anti-isolation”) And then used to predict the amount passing the actual cut. Cosmic Bkg estimation Observe the rate and mass distribution of events with: 3 < |zo-z(PV)| < 200mm // |d0| > 0.3mm The number of events in the final sample is obtained by scaling to the number of those expected to pass the initial cuts. 17
Limits Expected sensitivity: generate Monte Carlo pseudoexperiments using only SM processes, in proportion to their expected rate. We find the 95% CL upper limit for each pseudoexperiment for each fixed possible value of MZ’: Dk: expected events from Bkg template in mass bin Nk: ( Z’ + Dk events) such as Probability < 5% Z’ events (for rejection) in mass bin NZ,Z’: 70 < Mμμ<110GeV Z’ events to cross-section: A: total acceptance & efficiency Distribution of Z’ events: Median of distribution of several pseudo-exps: BLACK dotted line (“expected”) Ensemble of limits: 68% (green), 95% (yellow) envelope of limits Observed sensitivity (RED line): same as above, but with Dkfrom DATA.
Systematic uncertainties 1). Production model uncertainties to signal and DY background. QCD, E/Wk-factors - PDFs. QCD k-factor: 3%, E/W k-factor: 4.5% PDF: 3% @ Z pole, 6% @ 1TeV, 9% @ 1,5TeV (k-factors next page) W+jets cross section: 28% (NNLO), tt: 9.5% (NNLO) Diboson cross section: 5% (NLO) 2). Trigger efficiency (event-based) Scale Factor: 1.002±0.002±0.006 (both μ @ Β) /1.0009±0.0004±0.0011 (both μ @ EC) 1.002±0.001±0.002 (B + EC) 3). Muon reconstruction efficiency. Mainly due to brems. in Calorimeter: 3% effi loss in 1TeV, grows with mass. Conservative estimation on this uncertainty: 100% of itself. 4) Momentum scale & resolution @ high momenta Gaussian smearing: δ(q/pT) = S1·g1·(q/pT) + S2·g2 S2 (dominated by MS) = (0.18±0.04)TeV-1 (B&EC) / (0.69±0.20)TeV-1 (CSC) S1 determined from smeared MC fit to the data (for B, EC, CSC)
K-factors e/w K-factors