Download
1 / 36
370 likes | 607 Views
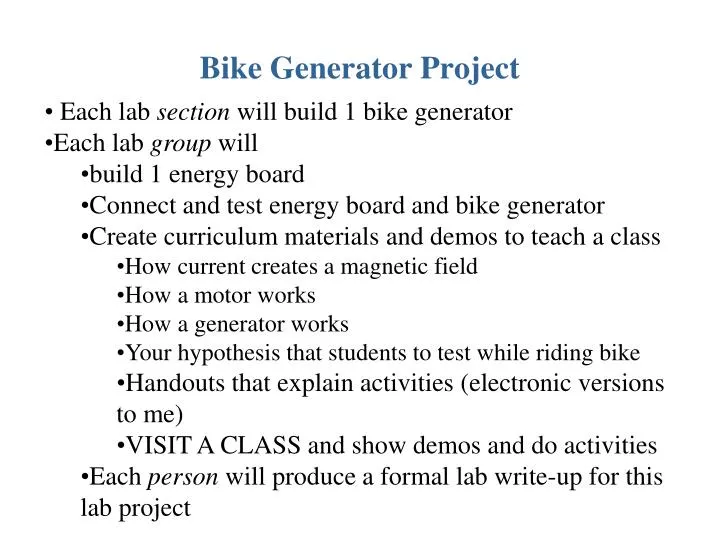
Bike Generator Project. Each lab section will build 1 bike generator Each lab group will build 1 energy board Connect and test energy board and bike generator Create curriculum materials and demos to teach a class How current creates a magnetic field How a motor works

E N D
Bike Generator Project • Each lab section will build 1 bike generator • Each lab group will • build 1 energy board • Connect and test energy board and bike generator • Create curriculum materials and demos to teach a class • How current creates a magnetic field • How a motor works • How a generator works • Your hypothesis that students to test while riding bike • Handouts that explain activities (electronic versions to me) • VISIT A CLASS and show demos and do activities • Each person will produce a formal lab write-up for this lab project
Wave Speed The speed of transverse waves on a string stretched with tension Ts is where μis the string’s mass-to-length ratio, also called the linear density.
EXAMPLE 20.1 The speed of a wave pulse QUESTION:
One-Dimensional Waves • To understand waves we must deal with functions of two variables, position and time. • A graph that shows the wave’s displacement as a function of position at a single instant of time is called a snapshot graph. For a wave on a string, a snapshot graph is literally a picture of the wave at this instant. • A graph that shows the wave’s displacement as a function of time at a single position in space is called a history graph. It tells the history of that particular point in the medium.
EXAMPLE 20.2 Finding a history graph from a snapshot graph QUESTION:
Sinusoidal Waves • A wave source that oscillates with simple harmonic motion (SHM) generates a sinusoidal wave. • The frequencyf of the wave is the frequency of the oscillating source. • The periodT is related to the wave frequency f by • The amplitudeA of the wave is the maximum value of the displacement. The crests of the wave have displacement Dcrest = A and the troughs have displacement Dtrough = −A.
Sinusoidal Waves • The distance spanned by one cycle of the motion is called the wavelengthλof the wave. Wavelength is measured in units of meters. • During a time interval of exactly one period T, each crest of a sinusoidal wave travels forward a distance of exactly one wavelength λ. • Because speed is distance divided by time, the wave speed must be or, in terms of frequency
Sinusoidal Waves • The angular frequency of a wave is • The wave number of a wave is • The general equation for the displacement caused by a traveling sinusoidal wave is This wave travels at a speed v = ω/k.
Waves in Two and Three Dimensions • Suppose you were to take a photograph of ripples spreading on a pond. If you mark the location of the crests on the photo, these would be expanding concentric circles. The lines that locate the crests are called wave fronts, and they are spaced precisely one wavelength apart. • Many waves of interest, such as sound waves or light waves, move in three dimensions. For example, loudspeakers and light bulbs emit spherical waves. • If you observe a spherical wave very, very far from its source, the wave appears to be a plane wave.
Sound Waves • For air at room temperature (20°C), the speed of sound is vsound = 343 m/s. • Your ears are able to detect sinusoidal sound waves with frequencies between about 20 Hz and about 20,000 Hz, or 20 kHz. • Low frequencies are perceived as “low pitch” bass notes, while high frequencies are heard as “high pitch” treble notes. • Sound waves exist at frequencies well above 20 kHz, even though humans can’t hear them. These are called ultrasonic frequencies. • Oscillators vibrating at frequencies of many MHz generate the ultrasonic waves used in ultrasound medical imaging.
Test your hearing • www.phys.unsw.edu.au/jw/hearing.html
EXAMPLE 20.6 Sound wavelengths QUESTION:
Electromagnetic Waves • A light wave is an electromagnetic wave, an oscillation of the electromagnetic field. • Other electromagnetic waves, such as radio waves, microwaves, and ultraviolet light, have the same physical characteristics as light waves even though we cannot sense them with our eyes. • All electromagnetic waves travel through vacuum with the same speed, called the speed of light. The value of the speed of light is c = 299,792,458 m/s. • At this speed, light could circle the earth 7.5 times in a mere second—if there were a way to make it go in circles!
The Index of Refraction • Light waves travel with speed c in a vacuum, but they slow down as they pass through transparent materials such as water or glass or even, to a very slight extent, air. • The speed of light in a material is characterized by the material’s index of refractionn, defined as
Intensity and Decibels • Human hearing spans an extremely wide range of intensities, from the threshold of hearing at ≈ 1 × 10⁻¹² W/m2(at midrange frequencies) to the threshold of pain at ≈ 10 W/m2. • If we want to make a scale of loudness, it’s convenient and logical to place the zero of our scale at the threshold of hearing. • To do so, we define the sound intensity level, expressed in decibels (dB), as where I0 = 1 × 10⁻¹² W/m2.
The Doppler Effect • An interesting effect occurs when you are in motion relative to a wave source. It is called the Doppler effect. • You’ve likely noticed that the pitch of an ambulance’s siren drops as it goes past you. A higher pitch suddenly becomes a lower pitch. • As a wave source approaches you, you will observe a frequency f+ which is slightly higher than f0, the natural frequency of the source. • As a wave source recedes away from you, you will observe a frequency f− which is slightly lower than f0, the natural frequency of the source.
The Doppler Effect The frequencies heard by a stationary observer when the sound source is moving at speed v0 are The frequencies heard by an observer moving at speed v0 relative to a stationary sound source emitting frequency f0 are
Snapshot and History Wave Activity • PHET and Matlab • phet.colorado.edu/sims/wave-on-a-string/wave-on-a-string_en.html • Turn on the ruler and create a snapshot graph (amplitude vs. displacement graph) • Select a green bead and center the left side of the ruler on it • Turn on the timer • Choose oscillate and pause the simulation to collect amplitude and time data for that green bead • Record your data in Matlab • Plot and fit your data to create a history graph (amplitude vs. time)