Download
1 / 28
280 likes | 434 Views
Characteristics of AES. Few Drivers… Foodgrains have gone up from 51 m t to 212 m t NCA as a % of GA has increased from 42 to 47 - intensification Foodgrains occupy 65% of the area, oilseeds 15% Share of wheat increased from 7.6% to 13%, share of oilseeds increased from 8.3% to 15%,

E N D
Few Drivers… • Foodgrains have gone up from 51 m t to 212 m t • NCA as a % of GA has increased from 42 to 47 - intensification • Foodgrains occupy 65% of the area, oilseeds 15% • Share of wheat increased from 7.6% to 13%, • share of oilseeds increased from 8.3% to 15%, • share of pulses has fallen 16% to 13%, • share of horticulture increased from 1.3% to 4% • Total livestock increased from 293m to 480m
Few Drivers … • 92% of available runoff is used for irrigation. Irrigation efficiency amongst the poorest in the world (25-30%) • NIA covers 57 M ha and has increased from 18% to 40% of NCA - Canals – 31%; wells – 58%; share of wells has shot up; tank irrigation has decreased • Total NPK risen from 70 K t to 17500 k t; consumption of pesticides 24 k t (1971) to 85 k in 1994-95 • Tractors have increased from 8600 to 2.2m
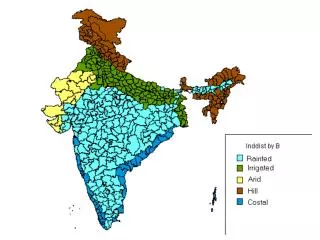
AES wise drivers … Arid System (AES) • Large Irrigation Projects • Grazing and common lands being put under crops • Cropping pattern towards water intensive crops • Growth in livestock • Mechanization of agriculture Coastal System (AES) • Conversion of forestland to agricultural land/aquaculture • Growth of modern/intensive aquaculture • Low level of fertilizer use • Coir production Hill & Mountainous System (AES) • Shifting cultivation • Conversion of forest land to agricultural land • Mono cropping • Overgrazing
Drivers … Irrigated System (AES) • Predominance of rice-wheat sequence • Expansion of irrigation • Use of chemical fertilizers and pesticides • Burning of rice-wheat straw Rainfed System (AES) • Spread of agriculture into marginal lands • Changes in mixed systems • Inability to invest in adequate inputs/technologies • Limited scientific progress & infrastructure • Spread of irrigation • Rainy season fallow
Environmental Impacts • Soil • Wind erosion in arid systems due to tillage 756-1180 t/ha and due to disc ploughing 2630-3160 t/ha (during a sand storm) • Erosion due to shifting cultivation in H&M systems 30 to 170 t/ha/yr and upto 763 t/ha in hill cultivation of Doon Valley • Soil salinization is significant in irrigated, arid and rainfed systems due to introduction of canal irrigation – 2.7 mill ha in the 5 states of the Indo gangetic plain, 1.2 mill ha in Rajasthan and 1.4 mill ha in the semi-arid states • Waterlogging due to rise in groundwater table upto 0.2 to 2 m in arid systems and 1-3 m in irrigated systems • 1.7 mill ha under waterlogging in the semi-arid states, 2.1 mill ha under the 5 states of Indo-gangetic plain
Water • In Arid and Irrigated systems a fall of 30-100 cms in groundwater, annually • Ground water pollution - About 20-25% of the samples had NO3>45 mg L-1 in Bihar and Haryana, while in rainfed states, the 10-50% of them were above NO3>45 mg L-1 in the semi-arid areas • Fertilizer residue of 5*106 tons, pesticides residue of 65,000 tons and sediments of 1600 m tons enters the coastal waters of India annually. • Fall in reservoir capacities and flooding in the plains • Air • Carbon emissions due to burning of rice wheat straw in irrigated systems 22,000 Gg/year • Methane emissions from R-W system
Poverty Module • Total no. of poor in India: 260 million in 1999-2000 • About three-quarters of poor live in rural areas and depend mostly on agriculture for their livelihood • GR: instrumental in improving rural livelihood opportunities since early 1970s • Trends in Poverty • Fluctuations till 1973; declining trend after that • The falling poverty trend: a general feature in almost all the states in India; rates of fall differ substantially • Issues:Relationship between Agri. growth and poverty reduction extensively studied in India
Does trickle down process operate in India? • Role of relative food prices, wage rate and dev. expenditure emphasized in several studies • NSSO data 1960 onwards and official Poverty line • Concentration in 7 states: Orissa, Bihar, Madhya Pradesh, Maharashtra, Assam, Uttar Pradesh and West Bengal, – about 75% of the India’s poor • High incidence of poverty among the scheduled tribe (46%) and scheduled caste (36%)
Determinants • Panel data used for 14 major Indian States since 1960 with 20 rounds of NSS surveys. • State dummies introduced in order to capture state specific effects.
Conclusions • Agricultural developments have strong influence on poverty through several channels: income/yield, wage, relative prices. • Yld channel likely to operate through irrigation whose effect is evident among all social groups • Evidence indicates concentration of poor in the seven states in North, East and Central parts of India where agri. growth has been rather slow. • Agricultural growth be extended to these regions. • Poverty is highly prevalent among certain social groups such as ST and SC. • Efforts must be made to integrate them with mainstream economic activities and strengthen linkage with agri. growth • SCs spread all over India, STs concentrated in the above region. Regional and social group focus needed in poverty reduction strategy in India
Food Security Concerns in India • GR and supportive government policies helped national food security and self -sufficiency • There is concern about self- sufficiency given falling public investment in agriculture • Do we need to be self- sufficient in food production? • Crop mix to be decided by market forces and re-distributive policies to take care of problems of poverty and food insecurity? • Given weaknesses in various re-distributive programs this strategy may not work. Besides self-sufficiency provides insurance against disruptions.
Large country intervention in thin foodgrains market argument • Aggregate and Household level Food security • Despite national FS, household FS remains • Although subsidy programs like PDS and other income generating schemes exist, HH food security concerns remain • Poor in rural areas are mostly agricultural labour and self employed in agriculture
Large percentage of children in both rural and urban areas are stunted and wasted • Per capita nutrient intake of HH have not improved much. Calorie and protein intake of HH remain below corresponding RDA • Observed trend fall in Cereal consumption in India • Reasoning of diversification of food basket countered by the existing nutritional deficiency, especially among the poorest sections.
Buffer: Kerala Migrants Survey, 2001 • Gulf emigrant stock 1.32 mil, one in every 5 Hhs; 0.7 m return migrants • Relative magnitude of Gulf remittances 23% of SDP • Typical emigrant Ag. worker, works 6yrs abroad, earns 9 times more • Migrant numbers invested in Ag.---52.46 % • Gulf savings invested in Ag.---28.7 % • Ag.workers among Gulf emigrants---22.3 % • Return migrants settled in Ag.---24.8 % • Former Ag.workers settled back in Ag.---68.9 % • Former non-Ag.workers settled in Ag.---3.2 %
Migrant plumbers of Orissa • 2 Field Surveys on plumbers: 413 source, 511 in Delhi • 90 % literate, 70 % from Ag. background, 85 % peasant communities • Unmarried, aged around 20s, stays around 2 decades in the urban areas • 2/3rds visit at least once a year, stays 1-3 weeks, 1/4th participate in Ag. Activities • 2/3rds of 309 return plumbers settled in Ag. • 82 % make regular remittances back home • 2/3rds remit for family maintenance, 15 % for land purchase 9 % for house construction, 4 % for repairs, 1 % for irri.well, 1 % for livestock
Social Viability and Agrarian Economy • Sluggish Growth in production, and productivity and high regional disparity • Growth of rural NFE less than that in urban. • Growth of rural NFE in 90’s less than preceding decade • High rural unemployment rate
High rural NFE in a state or a region does not necessarily imply healthy economic development • NFE growth around few large cities or industrial corridors • Large parts of NFE growth induced by poverty • Rural absorption of low yield surplus labour
Urban economies growing fast but do not absorb labour force • Inter state migration on decline • RU migration on decline, putting pressure on rural economy and its infrastructure • Prosperous states becoming less hospitable and in-migrating • Poorer states less out-migrating.
Degenerated peripheralisation • Urban centres pushing out their problems to their peripheries • High unemployment, low income, low literacy high IMR and low health indicators in the immediate peripheries • Low socio-economic indicators in periphery underscoring costs of RU adjustment • Case Studies from Punjab and TN peasant risk sharing in labour markets to absorb market shocks and burden sharing by region and caste based groups
Culture Module • Agriculture as an Unrewarding Occupation • Falling growth rate in agriculture. National Agriculture Policy 2000 says “Agriculture is unrewarding” for cultivators • Rural agriculture employment prospects limited • Frequent complaints about soil fertility and agr. infrastructure • Increased Rural Non Farm Employment (RNFE) • 45.5% of Rural NDP from RNFE in India • RNFE not always distress diversification – present among all classes in north India
Variations in North Indian Villages • Collapse of jajmani system: organic caste division of labour • In Punjab and west UP, RNFE spread across a variety of occupations from beauty parlours to football stitching • In Punjab and west UP upper castes present in a variety of RNFE • In east UP upper caste hardly present in RNFE • Conclusion: Caste and occup. rigidity stronger in east UP
Caste and Family Relations • Scheduled Castes become militant, resist performing degrading work • Agrarian politics not centred around landowner-landless relations • Now farmers’ movements – against state • Joint family under duress in all villages studied – more among lower classes
Conclusions • There is national FS but not sub-national - regional, household, individual • Agriculture delivered prosperity, but endemic poverty persists: NI, RF, SA regions, East, Central India They envelop STs and SCs, mostly in these regions • Agri. brought prosperity with environ damage. Focus should shift from large dams, seed-fertilizer strategy
Focus on technology which mitigate neg. ext.; focus in the small - irri, poor farmer/region & HH • These will bring higher and dispersed prosperity, preserve env, reduce poverty & social excl. • Refocusing will preserve rural economy and social viability • Refocusing will retain village society with culture and ambience with modernity • Plenty more care and attention to agriculture, rural education and primary healthcare