Exercise Sheet 3
Exercise Sheet 3. Exercise 7.: ROLAP Algebra Assume that a fact table SalesCube has 3 hierarchies with attributes ear , Month M, Productgroup P and City C and the measure sales. Assume that the attributes have the following cardinalities: = 3 M = 12 P = 500

Exercise Sheet 3
E N D
Presentation Transcript
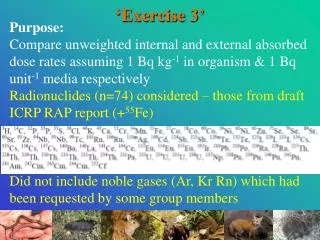
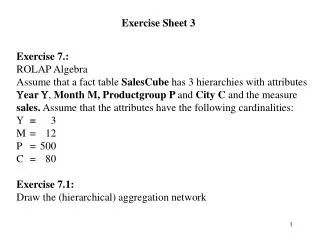
Exercise Sheet 3 • Exercise 7.: • ROLAP Algebra • Assume that a fact table SalesCube has 3 hierarchies with attributes • ear , Month M, Productgroup P and City C and the measure • sales. Assume that the attributes have the following cardinalities: • = 3 M = 12 P = 500 C = 80 • Exercise 7.1: • Draw the (hierarchical) aggregation network
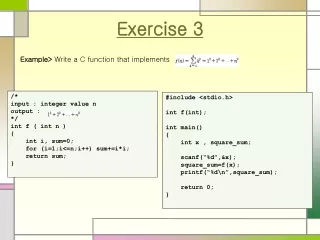
Exercise 7.2.: Construct the ROLAP expression to compute the average and maximal sales for the groups { ,P}, {, C} and {P} Exercise 7.3: Translate the ROLAP expression of Exercise 7.2 into a single SQL statement and estimate its cost = total number of tuples read + total number of tuples written if you assume that there is no optimization of this SQL statement. Exercise 7.4: Translate the SQL statement of Exercise 7.3 into several SQL statements employing auxiliary tables for intermediate results. Try to minimize the cost.
Solution 7.1: (ALL, ALL, ALL) (ALL, ALL, C) 80 (ALL, P, ALL) 500 (Y, ALL, ALL) 3 (Y, P, ALL) 1.500 (M, ALL, ALL) 36 (ALL, P, C) 40.000 (Y, ALL, C) 240 (Y, P, C) 120.000 (M, ALL, C) 2.880 (M, P, ALL) 18.000 (M, P, C) 1.440.000 = n
Solution 7.2: POT(SalesCube,{{Y,P}, {Y,C},{P}}, {sum(sales), avg(sales)}) cost (Y,P) = n + 2*18.000 + 1.500 cost (Y,C) = n + 2*2.880 + 240 cost (Y,P) = n + 2*18.000 + 2*1.500 + 500 reading and writing of intermediate results with insufficient cache
Solution 7.3: Select Y,’ALL’, P, ’ALL’ sum(sales), avg(sales) From SalesCube Group By Y,P Union Select Y, ’ALL’, ’ALL’, C, sum(sales), avg(sales) From SalesCube Group By Y,C Union Select ’ALL’, ’ALL’, P, ’ALL’ sum(sales), avg(sales) From SalesCube Group By P Cost assuming n fact tuples and sufficient cache: 3 * n // read ops + 3*500 // {Y,P} + 3*80 // {Y,C} + 500 // {P} = 3*n + 2240
Solution 7.4: Select Y,P,C, sum(sales), avg(sales) into YPC From SalesCube Group By Y,P,C; Select Y,P, sum(sales), avg(sales) into YP From YPC Group By Y,P; Select P, sum(sales), avg(sales) From YP Group By P Union Select * From YP Union Select Y,C, sum(sales), avg(sales) From YPC Group By YC; Cost assuming n fact tuples: size YPC is 120.000 tuples n // read SalesCube + 3*500*80 // gen YPC + 3*500*80 // read YPC + 3*500 // gen YP + 3*500*2 // read YP + 3*500*80 // read YPC + 500 + 500*3 + 3*80 // write result = n + 4500 + 360000+2240 n + 370000 << 3*n !! (for realistic size of n)
Exercise 8: Clustering Exercise 8.1: Compute the NN distances for the following set of points and label the corresponding edges. A * D * B C * *
Solution 8.1. NN(A,B) = 1 NN(A,C) = 2 NN(A,D) = 3 NN(B,A) = 2 NN(B,C) = 1 NN(B,D) = 3 NN(C,A) = 3 NN(C,B) = 1 NN(C,D) = 2 NN(D,A) = 3 NN(D,B) = 2 NN(D,C) = 1 Solution 8.2: Compute the mutual nearest neighbor distances for the points of Exercise 8.1 MND(A,B) = 3, MND(A,C)= 5, MND(A,D)=6 MND(B,C)=2 , MND(B,D)=5, MND(C,D)=3
Solution 8.3: Minimal spanning tree E F G C D B A H I J Solution 8.4: 2 clusters: {J}, {A,B,C,D,E,F,G,H,I} 4 clusters: {J}, {A,B,C,I}, {H}, {D,E,F,G} or {J}, {A,B,C,H}, {I}, {D,E,F,G} 5 clusters: {J}, {A,B,C}, {I}, {H}, {D,E,F,G}
Exercise 8.5: Which clusters result from the k-means algorithm if we use the small circles as starting centroids for the clusters? E F G C o D o B A H I o o J