Download
1 / 64
670 likes | 800 Views
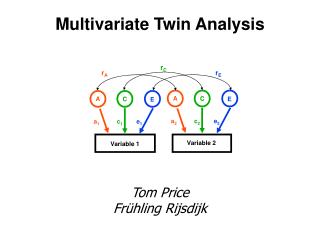
Multivariate Analysis. Nick Martin, Hermine Maes TC21 March 2008 HGEN619 10/20/03. Practical Example. Dataset: NL-IQ Study 6 WAIS-III IQ subtests var1 = onvolledige tekeningen / picture completion var2 = woordenschat / vocabulary var3 = paren associeren / digit span

E N D
Multivariate Analysis Nick Martin, Hermine Maes TC21 March 2008 HGEN619 10/20/03
Practical Example • Dataset: NL-IQ Study • 6 WAIS-III IQ subtests • var1 = onvolledige tekeningen / picture completion • var2 = woordenschat / vocabulary • var3 = paren associeren / digit span • var4 = incidenteel leren / incidental learning • var5 = overeenkomsten / similarities • var6 = blokpatronen / block design • N MZF: 27, DZF: 70
Scientific Questions • Are these IQ subtests determined by the same genes [single common genetic factor]? • Are there group factors, e.g. verbal versus performance IQ? • What is the structure for C and E?
Outline for the afternoon • Fit ACE Cholesky • Simplify Cholesky: do we need all sources? • Factor Models • Independent Pathway Model • Modify IP Models • Common Pathway Model
Files to Copy to your Computer • Faculty/hmaes/a21/maes/multivariate • *.rec • *.dat • *.mx • Multivariate-mac.ppt
Multivariate Questions I • Bivariate Analysis: What are the contributions of genetic and environmental factors to the covariance between two traits? • Multivariate Analysis: What are the contributions of genetic and environmental factors to the covariance between more than two traits?
Saturated Model • Use Cholesky decomposition to estimate covariance matrix • Fully saturated • Model: Cov P = F*F’ • F: Lower nvar nvar
Practical Example • Dataset: NL-IQ Study • 6 WAIS-III IQ subtests • var1 = onvolledige tekeningen / picture completion • var2 = woordenschat / vocabulary • var3 = paren associeren / digit span • var4 = incidenteel leren / incidental learning • var5 = overeenkomsten / similarities • var6 = blokpatronen / block design • N MZF: 27, DZF: 70
Dat Files • iqnlmz.dat • Data NInputvars=18 • Missing=-1.00 • Rectangular File=iqnl.rec • Labels famid zygos • age_t1 sex_t1 var1_t1 var2_t1 var3_t1 var4_t1 var5_t1 var6_t1 • age_t2 sex_t2 var1_t2 var2_t2 var3_t2 var4_t2 var5_t2 var6_t2 • Select if zygos < 3 ; !select mz's • Select • var1_t1 var2_t1 var3_t1 var4_t1 var5_t1 var6_t1 • var1_t2 var2_t2 var3_t2 var4_t2 var5_t2 var6_t2 ; • iqnldz.dat • .... • Select if zygos > 2 ; !select dz's • ....
MATRIX M This is a FULL matrix of order 1 by 6 1 2 3 4 5 6 1 64 65 66 67 68 69 MATRIX X This is a LOWER TRIANGULAR matrix of order 6 by 6 1 2 3 4 5 6 1 1 2 2 3 3 4 5 6 4 7 8 9 10 5 11 12 13 14 15 6 16 17 18 19 20 21 MATRIX Y This is a LOWER TRIANGULAR matrix of order 6 by 6 1 2 3 4 5 6 1 22 2 23 24 3 25 26 27 4 28 29 30 31 5 32 33 34 35 36 6 37 38 39 40 41 42 MATRIX Z This is a LOWER TRIANGULAR matrix of order 6 by 6 1 2 3 4 5 6 1 43 2 44 45 3 46 47 48 4 49 50 51 52 5 53 54 55 56 57 6 58 59 60 61 62 63
MATRIX M This is a FULL matrix of order 1 by 6 1 2 3 4 5 6 1 8.6579 6.5193 8.1509 8.8697 6.9670 7.9140 MATRIX P This is a computed FULL matrix of order 18 by 6 [=S*X_S*Y_S*Z] VAR1 VAR2 VAR3 VAR4 VAR5 VAR6 A1 0.8373 0.0000 0.0000 0.0000 0.0000 0.0000 A2 -0.0194 0.8774 0.0000 0.0000 0.0000 0.0000 A3 0.1209 0.1590 -0.6408 0.0000 0.0000 0.0000 A4 0.3281 0.1001 -0.6566 0.0235 0.0000 0.0000 A5 0.1680 0.4917 0.0297 -0.1399 -0.0002 0.0000 A6 0.3087 0.3156 -0.2956 -0.7862 -0.0009 -0.0003 C1 -0.2040 0.0000 0.0000 0.0000 0.0000 0.0000 C2 -0.2692 0.0045 0.0000 0.0000 0.0000 0.0000 C3 0.0586 0.0608 -0.0234 0.0000 0.0000 0.0000 C4 0.0552 0.0126 -0.0043 0.0000 0.0000 0.0000 C5 -0.5321 -0.1865 0.0724 -0.0001 0.0002 0.0000 C6 -0.0294 0.0463 -0.0198 0.0000 0.0000 0.0000 E1 -0.5072 0.0000 0.0000 0.0000 0.0000 0.0000 E2 -0.1656 -0.3604 0.0000 0.0000 0.0000 0.0000 E3 -0.0630 -0.1009 0.7264 0.0000 0.0000 0.0000 E4 0.1751 -0.0590 0.3896 -0.5114 0.0000 0.0000 E5 -0.0941 -0.0660 -0.0411 -0.0367 -0.6084 0.0000 E6 -0.0978 0.0803 0.0224 -0.0449 -0.0393 -0.2761
Exercise I • Fit AE Cholesky Model • A • E
Solution I • …. • Option Multiple • End • Drop Y 1 1 1 - Y 1 nvar nvar • End
Factor Analysis • Explain covariance by limited number of factors • Exploratory / Confirmatory • Model: Cov P = F*F’ + E*E’ • F: Full nvar nfac • E: Diag nvar nvar • Model: Cov P = F*I*F’ + E*E’
Single [Common] Factor • X: genetic • Full 4 x 1 • Full nvar x nfac • Y: shared environmental • Z: specific environmental
Residual Factors • T: genetic • U: shared environmental • V: specific environmental • Diag 4 x 4 • Diag nvar x nvar
IP • Independent pathways • Biometric model • Different covariance structure for A, C and E
Independent Pathway I • G1: Define matrices • Calculation • Begin Matrices; • X full nvar nfac Free ! common factor genetic path coefficients • Y full nvar nfac Free ! common factor shared environment paths • Z full nvar nfac Free ! common factor unique environment paths • T diag nvar nvar Free ! variable specific genetic paths • U diag nvar nvar Free ! variable specific shared env paths • V diag nvar nvar Free ! variable specific residual paths • M full 1 nvar Free ! means • End Matrices; • Start … • Begin Algebra; • A= X*X' + T*T'; ! additive genetic variance components • C= Y*Y' + U*U'; ! shared environment variance components • E= Z*Z' + V*V'; ! nonshared environment variance components • End Algebra; • End indpath.mx
Independent Pathway II • G2: MZ twins • #include iqnlmz.dat • Begin Matrices = Group 1; • Means M | M ; • Covariance A+C+E | A+C _ • A+C | A+C+E ; • Option Rsiduals • End • G3: DZ twins • #include iqnldz.dat • Begin Matrices= Group 1; • H full 1 1 • End Matrices; • Matrix H .5 • Means M | M ; • Covariance A+C+E | H@A+C _ • H@A+C | A+C+E ; • Option Rsiduals • End
Independent Pathway III • G4: Calculate Standardised Solution • Calculation • Matrices = Group 1 • I Iden nvar nvar • End Matrices; • Begin Algebra; • R=A+C+E; ! total variance • S=(\sqrt(I.R))~; ! diagonal matrix of standard deviations • P=S*X_ S*Y_ S*Z; ! standardized estimates for common factors • Q=S*T_ S*U_ S*V; ! standardized estimates for spec factors • End Algebra; • Labels Row P a1 a2 a3 a4 a5 a6 c1 c2 c3 c4 c5 c6 e1 e2 e3 e4 e5 e6 • Labels Col P var1 var2 var3 var4 var5 var6 • Labels Row Q as1 as2 as3 as4 as5 as6 cs1 cs2 cs3 cs4 cs5 cs6 es1 es2 es3 es4 es5 es6 • Labels Col Q var1 var2 var3 var4 var5 var6 • Options NDecimals=4 • End
MATRIX M This is a FULL matrix of order 1 by 6 1 2 3 4 5 6 1 37 38 39 40 41 42 MATRIX T This is a DIAGONAL matrix of order 6 by 6 1 2 3 4 5 6 1 19 2 0 20 3 0 0 21 4 0 0 0 22 5 0 0 0 0 23 6 0 0 0 0 0 24 MATRIX U This is a DIAGONAL matrix of order 6 by 6 1 2 3 4 5 6 1 25 2 0 26 3 0 0 27 4 0 0 0 28 5 0 0 0 0 29 6 0 0 0 0 0 30 MATRIX V This is a DIAGONAL matrix of order 6 by 6 1 2 3 4 5 6 1 31 2 0 32 3 0 0 33 4 0 0 0 34 5 0 0 0 0 35 6 0 0 0 0 0 36 MATRIX X This is a FULL matrix of order 6 by 1 1 1 1 2 2 3 3 4 4 5 5 6 6 MATRIX Y This is a FULL matrix of order 6 by 1 1 1 7 2 8 3 9 4 10 5 11 6 12 MATRIX Z This is a FULL matrix of order 6 by 1 1 1 13 2 14 3 15 4 16 5 17 6 18
Exercise II • Fit AE Independent Pathway Model • Ac • Ec • As • Es
Solution II • Drop Y matrix • Drop U matrix
WAIS-III IQ • Verbal IQ • var2 = woordenschat / vocabulary • var3 = paren associeren / digit span • var5 = overeenkomsten / similarities • Performance IQ • var1 = onvolledige tekeningen / picture completion • var4 = incidenteel leren / incidental learning • var6 = blokpatronen / block design
Exercise III • Fit 3AE Independent Pathway Model • Ac • A1 loading on all 6 vars • A2 loading on vars 1, 4, 6 • A3 loading on vars 2, 3, 5 • Ec • Es • Drop Ec
Solution III • X Full nvar 3 • Specify X • 1 7 0 • 2 0 10 • 3 0 11 • 4 8 0 • 5 0 12 • 6 9 0 • Group 4 • O= S*X • P= S*Y_S*Z;