Download
1 / 25
250 likes | 419 Views
Created by Maria Mendoza Towler 4B. Desert Garden. How can the locations and identities of different plants in Desert Garden be made available to visitors?. The Problem Question:. Upload the image of the Balboa Park (Desert Garden) Map in Arc Map using the Add Data Tool.

E N D
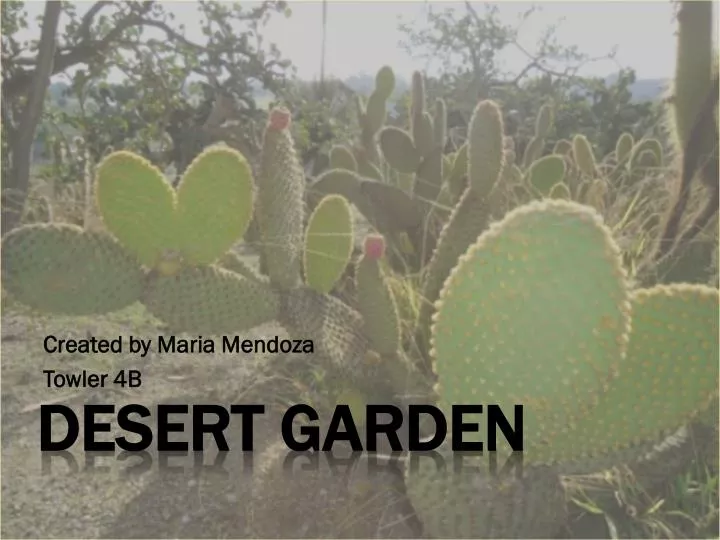
Created by Maria Mendoza Towler 4B Desert Garden
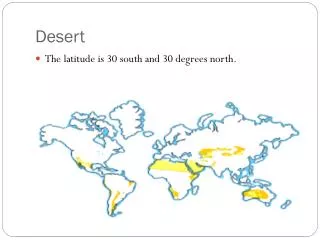
How can the locations and identities of different plants in Desert Garden be made available to visitors? The Problem Question:
Upload the image of the Balboa Park (Desert Garden) Map in Arc Map using the Add Data Tool Getting Started: Create Base Map
On Arc Catalog, Create a new blank shapefile • In the menu bar, click: File, New, then Shapefile • Name the shapefile (Wheelchair Accessible Concrete Trail) and change the “Feature Type” to polyline • Give the shapefile a coordinate system • Edit, Select, Geographic Coordinate System, North America, NAD 84 Creating a new layer: wheelchair accessible trail
Add the new shapefile to Arc Map that already contains the image of Desert Garden • On the Editor toolbar click on the “Editor” drop down, click “Start Editing” (Task should be “Create New Feature” and Target should be your blank shapefile [Wheelchair Accessible Concrete Trail]) Continued…
With the “Draw tool” option, outline the trail that is wheelchair accessible on the image • Once the trails are outlined, click on the drop down menu “Editor”, then “Save Edits”, and finally “Stop Editing” Continued…
right-click the layer titled “wheelchair accessible concrete trail” in the table of contents, scroll down and click “layer properties” Click on the “symbology tab”, then on the image under “Symbol” Knowing that I would have three trails to make in total, I decided to pick distinct colors change the symbology
For the wheelchair accessible concrete trail, I decided to go with the symbol labeled “Expressway” since it is a bold red line • Click Ok to close that window, and Ok again to apply the new symbology • You’ll notice that the preview under the layer title has changed Continued…
Create another Shapefile on Arc Catalog with the same steps previously used, but name this Shapefile “Decomposed Granite Trail” Click “Add Data” on your Arc Map file and add the new shapefile Creating a new layer: decomposed granite trail
On the Editor toolbar in the “Edit” drop down, click “Start Editing” (Task should be “Create New Feature” and Target should be your blank shapefile [Decomposed Granite Trail]) • With the “Draw tool” option, outline the trail that was created for the public on the image Continued…
Once the trails are outlined, click on the drop down menu “Editor”, then “Save Edits”, and finally “Stop Editing” Continued…
right-click the layer titled “decomposed granite trail” in the table of contents, scroll down and click “layer properties” Click on the “symbology tab”, then on the image under “Symbol” Change the symbology
For the decomposed granite trail, I decided to go with the symbol labeled “Freeway” since it is a bold red line • Click Ok to close that window, and Ok again to apply the new symbology • You’ll notice that the preview under the layer title has changed Continued…
Create another Shapefile on Arc Catalog with the same steps previously used, but name this Shapefile “Wheelchair Accessible Concrete Sidewalk” Click “Add Data” on your Arc Map file and add the new shapefile Creating a new layer: Wheelchair Accessible Concrete Sidewalk
On the Editor toolbar in the “Edit” drop down, click “Start Editing” (Task should be “Create New Feature” and Target should be your blank shapefile [Wheelchair Accessible Concrete Sidewalk]) • With the “Draw tool” option, outline the sidewalk Continued…
Once the sidewalk is outlined, click on the drop down menu “Editor”, then “Save Edits”, and finally “Stop Editing” Continued…
right-click the layer titled “Wheelchair Accessible Concrete Sidewalk” in the table of contents, scroll down and click “layer properties” Click on the “symbology tab”, then on the image under “Symbol” Change the symbology
For the Wheelchair Accessible Concrete Sidewalk, I decided to go with the symbol labeled “Stacked Multi Roadway” since it is a bold blue line • Click Ok to close that window, and Ok again to apply the new symbology • You’ll notice that the preview under the layer title has changed Continued…
The waypoints represent the various locations of the desert plants collected by the GPS unit The waypoints were then uploaded onto the computer, and transferred onto an Excel Spreadsheet Make a third column and label it ORDR, assigning a certain number to each coordinate to create a descending order Adding waypoints to the basemap
On ArcMap, click on the Tools Menu, and click on “Add XY Data” • Make sure to assign the appropriate coordinate system (WGS 1984.prj) • In the table of contents, right click the waypoints, click “Properties”, and change the Label Name to “Location of Plants” under the General Tab Continued…
Under the Symbology tab, change the symbol to Circle 2, and change the color to Red (to be noticeable) • Click on the Labels tab and change the Label Field to ORDR and use the Advanced Text to add a tan colored background to the number label • Click Ok to exit • Right click “Location of Plants” and click on “Label Features” • On your map, you should now see numbers next to the red circles Continued…
In the Insert Menu at the top, scroll down to “pictures…” and locate the pictures of the desert plants Drag the corners of the picture to resize it down to a smaller scale Arrange the pictures around the map Click the insert menu again and click on “Text” Type in the scientific name and number that corresponds to the location on the map Inserting the Pictures
Click on the Insert menu again and add the following: • North Arrow • Legend • Title (Desert Garden) • Scale Bar • “Created by” Final additions
The locations of the plants in the Desert Garden can be made available to visitors by showing a picture with an appropriate label with corresponding locations on a map of the garden from aerial view. This type of visual can be easily displayed, and easily understood for visitors to enjoy. Any Questions? conclusion