MGS RS Coverage
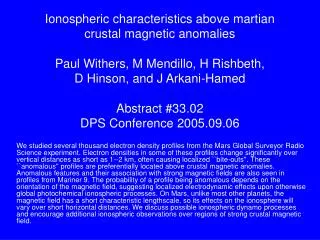
Ionospheric characteristics above martian crustal magnetic anomalies Paul Withers, M Mendillo, H Rishbeth, D Hinson, and J Arkani-Hamed Abstract #33.02 DPS Conference 2005.09.06.

MGS RS Coverage
E N D
Presentation Transcript
Ionospheric characteristics above martian crustal magnetic anomaliesPaul Withers, M Mendillo, H Rishbeth, D Hinson, and J Arkani-HamedAbstract #33.02DPS Conference 2005.09.06 We studied several thousand electron density profiles from the Mars Global Surveyor Radio Science experiment. Electron densities in some of these profiles change significantly over vertical distances as short as 1--2 km, often causing localized ``bite-outs''. These ``anomalous'' profiles are preferentially located above crustal magnetic anomalies. Anomalous features and their association with strong magnetic fields are also seen in profiles from Mariner 9. The probability of a profile being anomalous depends on the orientation of the magnetic field, suggesting localized electrodynamic effects upon otherwise global photochemical ionospheric processes. On Mars, unlike most other planets, the magnetic field has a short characteristic lengthscale, so its effects on the ionosphere will vary over short horizontal distances. We discuss possible ionospheric dynamo processes and encourage additional ionospheric observations over regions of strong crustal magnetic field.
MGS RS Coverage • Several thousand profiles between 60N and 86N • 220 profiles between 64S and 70S • 6 to 29 May 1999 • 69.1S to 64.7S • LST = 12.2 hrs to 12.0 hrs • SZA = 86.9 to 78.6 degrees • Ls = 135 to 146 degrees
Three MGS RS electron density profiles. Case 1 is 0320A58A, a typical NH profile, case 2 is 9132I11A, a typical SH profile, and case 3 is 9149E12A, a SH profile with an anomalous feature. For display purposes, electron densities in case 1 have been multiplied by 1, those in case 2 by 10, and those in case 3 by 100. 1-sigma uncertainties are marked by shaded regions.
Six anomalous electron density profiles. The height of each anomalous feature is marked by a thick horizontal bar.
Anomalous Profiles • If (DN/Dz) > Nmax / 6 km and DN/sN > 1/2, then we call the profile “anomalous” • 5 of 3529 NH profiles are anomalous (0.14%) • 20 of 220 SH profiles are anomalous (9.1%) • 17 of 43 profiles in 130-200E range are anomalous • 3 of 177 profiles outside 130-200E range are anomalous • Some Mariner 9 profiles are anomalous, but no PVO profiles from Venus are anomalous
Spatial Correlations • Cause of anomalous features must account for absence of anomalous profiles in NH and concentration in longitude of SH anomalous profiles. • Only satisfactory explanation is magnetic field • 16 of 20 anomalous SH profiles occur where B exceeds 100 nT at 150 km. B never exceeds this threshold between 60N and 86N
Anomalous MGS ionospheric profiles (crosses) and normal profiles (dots) from the Southern Hemisphere in 1999. The magnetic field at 150 km is shown by dotted contours at 100 nT and solid contours at 200 nT. Regions where the magnetic field is stronger than 200 nT are shaded.
Electron density profiles from Mariner 9. Some of these profiles appear anomalous after close inspection. The clearest examples, revolutions 19, 22, and 48, are circled. From Zhang et al. (1990)
Anomalous ionospheric profiles (crosses) and normal profiles (dots) from revolutions 1-79 of Mariner 9 in 1971-1972. Profiles from revolutions 2, 3, 4, 8, 12, 19, 22, 25, 29, 31, 48, and 54 appear to be anomalous. The magnetic field at 150 km is shown by dotted contours at 100 nT and solid contours at 200 nT. Regions where the magnetic field is stronger than 200 nT are shaded.
Map of the magnetic field of Mars at MGS mapping altitude of 400 (+/-30) km. The radial component of the magnetic field associated with crustal sources is illustrated using the color scale shown. Isomagnetic contours are drawn for Br = +/- 10, 20, 50, 100, 200 nT.
Effects of Geometry of Magnetic Field and Occultation • Inclination and azimuth affect whether a profile is anomalous or not. • Azimuthal dependence may be related to direction of the neutral wind or of the MGS-Earth ray path. Both have preferred directions. Models predict south-eastward to south-eastward winds of 100-200 ms-1. The MGS-Earth ray path was always 10-20 degrees west of north. • Define azimuth, Az, such that 0<Az<180 and inclination, I, such that 0<I<90 • 23 profiles occur where B>100nT and I<30 at 150 km. 13 of the 23 have 45<Az<135, of which 1 is anomalous, whereas 6 of the 10 profiles outside this Az range are anomalous • 41 profiles occur where B>100 nT and I>30. 27 of the 41 have 45<Az<135, of which 7 are anomalous, whereas 2 of the 14 profiles outside this Az range are anomalous
Discussion • Magnetic fields affect plasma transport within ionosphere, plasma instabilities (equatorial electrojet and equatorial instabilities near sunset), and influx of charged particles from space. All are possible causes of anomalous profiles. • Anomalous profiles are sharp vertical changes in electron density, or horizontal changes, or both, that have a spatial scale of a few km. • Modelling is needed to determine the cause of anomalous features, and the assumptions inherent in the data inversion should also be considered.
Magnetic fieldline that passes through the height of the anomalous feature (150.5 km) in profile 9129N30A at the profile’s latitude (68.6S) and longitude (165.6E). Magnetic fieldlines on Mars are very different from terrestrial dipolar fieldlines. In this example, the crest of the fieldline is only a scale height above the anomalous feature.
Martian Ionospheric Dynamo • Mars has strong winds, magnetic fields, and plasma, so dynamo action could occur on Mars. This could be connected with the anomalous features. • nin / wi = 1 at hi, 190 km and nen / we at he, 120 km, when B=100 nT. Ions are bound to fieldlines above hi and electrons are bound to fieldlines above he. The dynamo region, which is between he and hi, can span the main ionospheric peak on Mars.
Conductivities • Assume N = 3E4 cm-3 and H = 10 km • sPed peaks at he and hi, has peak value Ne/2B, thickness 2H, and height-integrated value SPed = 2NeH/B = 1000 mho, greater than the Earth’s 10 mho. • sHall is Ne/B between he and hi, so SHall = 3000 mho, greater than the Earth’s 20 mho.
Currents and Induced Field • Neutral wind U induces electric field of BU, which drives a Hall current of SHall BU = 30 A km-1, greater than Earth’s 10 A km-1 • This current in turn induces a magnetic field of m0SHall BU = (Ne/B) BU m0 (hi - he) = 40 nT, greater than Earth’s 10 nT. • The induced field of 40 nT, which is independent of B, is comparable to magnetic field strength in martian ionosphere. • Martian ionospheric currents may significantly modify the magnetic field that produces them
Conclusions • Some martian ionospheric profiles have large changes in electron density over vertical distances as short as 1-2 km. • These anomalous features are seen in MGS and Mariner 9 data, but not in Venus data. • Anomalous profiles are concentrated over regions of strong magnetic field. • The abundance of anomalous profiles is affected by the inclination and azimuth of the magnetic field • The martian ionosphere should exhibit electrodynamic phenomena not seen at Earth, such as localized dynamo regions and local variations in transport processes