Download
1 / 26
260 likes | 476 Views
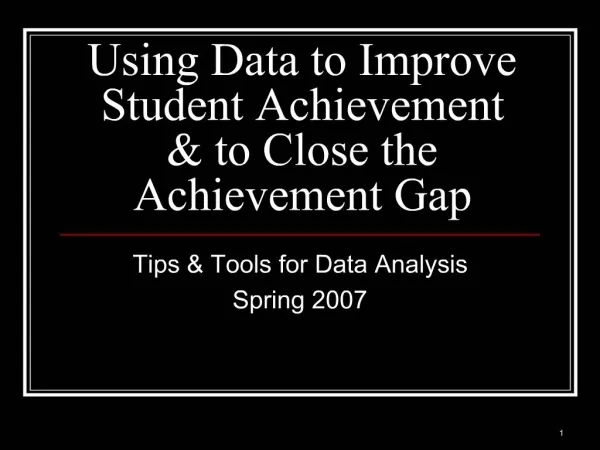
Using Data to Improve Instruction & Close the Achievement Gap. Jeannette LaFors, Ph.D. Envision Schools. Achievement Gap. Each day 3,000 U. S. students drop out of high school -- nearly 30% nationally Racial Gaps -- 25% difference between white & African-American students

E N D
Using Data to Improve Instruction & Close the Achievement Gap • Jeannette LaFors, Ph.D. • Envision Schools
Achievement Gap • Each day 3,000 U. S. students drop out of high school -- nearly 30% nationally • Racial Gaps -- 25% difference between white & African-American students • Gender Gaps -- 8% difference between boys and girls • Context Gaps -- >20% difference between rich & poor communities
Achievement Gap • >50% of high school grads are not prepared for college and work • >80% percent of students want to go to college, but <50% do • Nationally, barely 6 out of 10 students graduate from college, and gaps persist Even for those who DO graduate:
Some Thoughts on Data . . . • Can inspire fear or hope • Can draw attention to issues and put to rest others • Serve as tools • Simple numbers cannot describe complex realities, but they can help us think about them
Workshop Goals • Establish a Learning Community • Share Ideas, Practices & Tools to Improve Instruction and Close Achievement Gaps
Process • Establish Personal Connections • Describe work at Envision Schools • Apply a Self-Assessment Tool and Share our Work with Data with one another • Q&A • Debrief
Consider a time when you really studied or investigated something . . . • How was that endeavor initiated? • What was your initial goal? • What skills and/or information did you gather? • How comprehensive was your inquiry? • How much time and energy did you devote to it? • Did anyone help you with it? • How satisfied were you with your learning and understanding? • Where did that learning experience lead you?
Envision Schools • Non-profit, public schools (CMO) • High-performing clusters of schools to serve underserved populations • All our students graduate eligible for 4-year college/university in the CA system • Our FGCB students are four times more likely to obtain a 4-year degree than their peers
Relevance Relationships Rigor, Relevance, Relationships & Results State Standards Academic Skills Leadership Skills Rigor RESULTS Graduation Portfolio UC/CSU Courses CHSEE CA Standards Tests Community Personalization Advisory Team Project Learning Arts Technology
UNDERSTANDING (Application of knowledge) REFLECTION (Growth over time) Exhibitions, Demonstrations Tests, Quizzes, Reports, Recitations Portfolios, Journals, Observations Academic Rigor KNOWLEDGE (Acquisition)
We Ask Ourselves: • What we want our students to know and do? • How will we know when they have learned it? • What will we do when some of them do not learn it?
ES Graduation Goals • Proficiency / mastery in core subject areas (math, science, English/language arts, social studies, visual and performing arts) • Demonstration of Envision Leadership Skills (communication, critical thinking, collaboration, project management, creative expression, problem solving) • Use of technology and design in creating and presenting ideas across disciplines
Introduction about oneself and the portfolio • At least one certified core content area task in: social studies, English/Language Arts, science, math, visual & performing Arts • Reflective summaries • Internship Artifact/Reflection • Multi-media • Oral Presentation • Research paper Envision SchoolsGraduation PortfolioA Digital Arrangement of Work
ES Assessment System • Breadth - Completion of UC/CSU requirements & achievement of proficient or advanced on state standards assessments • Depth and mastery - Completion of multiple projects and tasks across and within core subject areas to provide evidence of student’s understanding and application of content and skills • Growth over time - Student performances and work archived for the purposes of benchmarking and reflection
What Data DoWe Collect? • Student Achievement • Student Engagement • Student Growth • Faculty Performance • Faculty Engagement/Satisfaction • Parent Engagement/Satisfaction • Equity
What Do We Need to Know? • How many students are scoring at each level of proficiency? • What percentage of students meet or exceed proficiency levels? • In which skills or knowledge areas do students have the more difficulty? • What are the names of students who need intensive support?
Metric Target Student dashboard Student engagement School attendance >95% Attendance in tutoring, extra skills period, summer school (if recommended) >95% Student development Annual academic growth (students below grade level) On track to graduate from Envision in 5 years Pre- and post-assessments in Reading, Writing, and Math Passing 9th - 10th grade exhibition performance Proficient or better 11th – 12th grade graduation portfolio On track to complete; complete with proficiency CAT 6/STAR scores Proficient or better High School Exit Exam Passing SAT Score of 1000 or above (CA average) Student outcomes College-ready HS graduation Graduation within 5 years 4-year college acceptance At least 1 acceptance 4-year college enrollment Enroll within 1 year of HS graduation 4-year college graduation (within 6 years) Graduate within 5 years
Embedded Inquiry Process • End-of-Year School Leadership Institute: • Collect Data/Analyze Data/Identify Gaps/Plan to Close Gaps • Monthly school-hosted Leadership PD Days • Analyze Data/Reflect on gaps and benchmarks/Plan PD for faculty within and across schools/Critique School Plans • School Performance Assessment (Exhibition)
Key Supports • Developing trust and relationships • Being clear about outcomes • Fostering data-driven inquiry • Striving for coherence -- aligning resources • Dedicating time to achieving outcomes • Finding good technology tools • Supporting strong school leadership
Challenges • Building trust around data and public practice • Ensuring the inquiry process extends to each teacher/classroom • Cultivating a demand for data • Finding good tools for maintaining and analyzing data • Maintaining a focus on the gaps
What Do You Collect and Use? • What data do you collect? • What data do you use? • How do you use the data? • What more do you need to know? • What do you need to do to get it?
Sharing . . . • What are your strengths and “best practices”? • Where are your gaps and challenges? • What resources might you apply to these challenges?