Download
1 / 17
170 likes | 280 Views
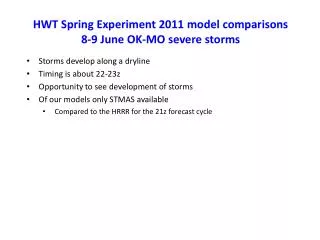
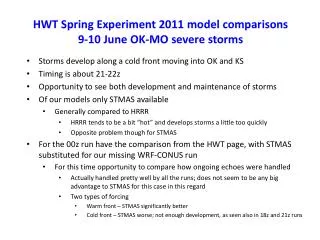
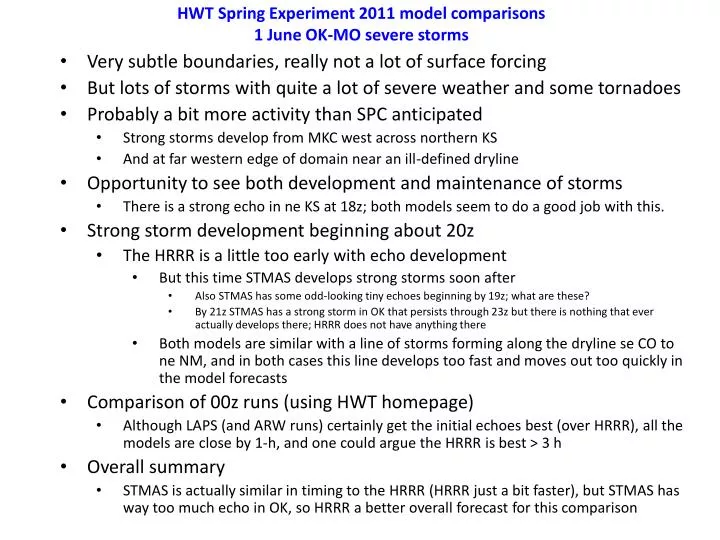
HWT Spring Experiment 2011 model comparisons 1 June OK-MO severe storms. Very subtle boundaries, really not a lot of surface forcing But lots of storms with quite a lot of severe weather and some tornadoes Probably a bit more activity than SPC anticipated

E N D
HWT Spring Experiment 2011 model comparisons1 June OK-MO severe storms Very subtle boundaries, really not a lot of surface forcing But lots of storms with quite a lot of severe weather and some tornadoes Probably a bit more activity than SPC anticipated Strong storms develop from MKC west across northern KS And at far western edge of domain near an ill-defined dryline Opportunity to see both development and maintenance of storms There is a strong echo in ne KS at 18z; both models seem to do a good job with this. Strong storm development beginning about 20z The HRRR is a little too early with echo development But this time STMAS develops strong storms soon after Also STMAS has some odd-looking tiny echoes beginning by 19z; what are these? By 21z STMAS has a strong storm in OK that persists through 23z but there is nothing that ever actually develops there; HRRR does not have anything there Both models are similar with a line of storms forming along the dryline se CO to ne NM, and in both cases this line develops too fast and moves out too quickly in the model forecasts Comparison of 00z runs (using HWT homepage) Although LAPS (and ARW runs) certainly get the initial echoes best (over HRRR), all the models are close by 1-h, and one could argue the HRRR is best > 3 h Overall summary STMAS is actually similar in timing to the HRRR (HRRR just a bit faster), but STMAS has way too much echo in OK, so HRRR a better overall forecast for this comparison
1 June 2011: Line of severe storms develops from KS to OK Slight Risk in place Storms begin to develop by 21z then line rapidly develops near and after 00z Opportunity to compare runs beginning at 18z/30 May Storm Prediction Center (SPC) Day 1 Outlook issued at 1619z on 1 June SPC severe weather reports for 1 June
1 June 2011 - overview 2000 UTC 1 June – Radar and observations 1800 UTC 1 June – Radar and obs 0000 UTC 2 June – radar and obs (with dryline position) 2200 UTC 1 June – radar and obs
1800 UTC 1 June 2011 runs – Analysis comparisons (composite reflectivity) 1800 UTC 1 June– Radar and observations 1800 UTC 1 June– Visible imagery Strong storms are underway in ne KS, maybe a very weak convergence boundary (~west-east) in that area. Dryline shown is very weak. STMAS appears to have a stronger echo in KS than the HRRR, but both models do a good job at the analysis time. HRRR STMAS
1800 UTC 1 June 2011 runs – 1-h forecast comparisons (composite reflectivity) 1900 UTC 1 June– Radar and observations 1900 UTC 1 June– Visible imagery Strong continue in ne KS with a few cells starting along the Front Range in CO/NM. Dryline shown continues to be quite weak. Not sure what is going on with all the tiny echoes in STMAS; the visible image does show a gathering of cu in these areas. HRRR is a little early with the storms in central KS. HRRR STMAS
1800 UTC 1 June 2011 runs – 2-h forecast comparisons (composite reflectivity) 2000 UTC 1 June– Radar and observations 2000 UTC 1 June– Visible imagery Pretty much the same thoughts as for 19z, except that STMAS seems too robust with development along the ill-defined dryline in eastern NM. HRRR STMAS
1800 UTC 1 June 2011 runs – 3-h forecast comparisons (composite reflectivity) 2100 UTC 1 June– Radar and observations 2100 UTC 1 June– Visible imagery Now both the HRRR and STMAS have too much development in OK to se KS. There are some storms se CO to eastern NM, but both models have too much in the forecast. HRRR STMAS
1800 UTC 1 June 2011 runs – 4-h forecast comparisons (composite reflectivity) 2200 UTC 1 June– Radar and observations 2200 UTC 1 June– Visible imagery STMAS has strong storms in OK that are not actually present. Both models have overdeveloped and over-organized the storms in se CO to eastern NM. HRRR STMAS
1800 UTC 1 June 2011 runs – 5-h forecast comparisons (composite reflectivity) 2300 UTC 1 June– Radar and observations 2300 UTC 1 June– Visible imagery STMAS continues to have strong storms in OK that are not actually present. Both models are similar but somewhat over-developed and over-organized with the storms in se CO/sw KS to ne NM. HRRR STMAS
1800 UTC 1 June 2011 runs – 6-h forecast comparisons valid 0000 UTC 2 June (composite reflectivity) 0000 UTC 2 June– Radar and observations 2345 UTC 1 June– Visible imagery The two forecasts are actually similar, now that the echoes in STMAS in OK are weakening. Both are too fast with the line coming out of se CO/ne NM, but have similar structure with this line. HRRR STMAS
Model comparison: 0000 UTC 2 June analyses LAPS and the ARW Thomp and Cycled runs do a better job than the HRRR in analyzing the initial echoes.
Model comparison 0000 UTC/2 June runs: 1-h forecasts Not shown here is the 15-min resolution found on the HWT page, and using that LAPS maintains a better portrayal of the initial echoes than the HRRR for about the first 30 min of the forecast. Here we see that all the runs have strong cells by 1-h. LAPS seems to not have the right structure in KS, where ARW/Cycled is best, and is too strong in MO.
Model comparison 0000 UTC/2 June runs: 2-h forecasts Each model has a somewhat different forecast when you look at the details. No model handles the new cells in south-central NE.
Model comparison 0000 UTC/2 June runs: 3-h forecasts Storms are weakening too quickly in all the model runs for the KS cells, with the HRRR doing better, although the location is off.
Model comparison 0000 UTC/2 June runs: 4-h forecasts Once again probably have to give the nod to the HRRR as best at 4-h in since it has the most number of strong storms in KS compared to the other models.
Model comparison 0000 UTC/2 June runs: 5-h forecasts While the HRRR is still strongest in KS, all the runs have active convection there. But all runs are having trouble with not only the details in KS but also overdoing things in MO.
Model comparison 0000 UTC/2 June runs: 6-h forecasts Certainly no model forecast does a great job by 6-h into this complex situation. Could say that LAPS is somewhat more of an under-forecast than the other models, but clearly the ARW runs have way too much going on in MO.