Download

1 / 16
210 likes | 395 Views
Fed-batch Cultivation Control based on Genetic Algorithm PID Controller Tuning. Olympia Roeva 1 , Tsonyo Slavov 2 1 Institute of Biophysics and Biomedical Engineering, BAS 2 Technical University - Sofia. Presentation outline. Introduction

E N D
Fed-batch Cultivation Control based on GeneticAlgorithm PID Controller Tuning Olympia Roeva1, Tsonyo Slavov2 1Institute of Biophysics and Biomedical Engineering, BAS 2Technical University - Sofia Numerical Methods & Applications 2010
Presentation outline • Introduction • Theoretical background ofthe PID control algorithm • Description of theconsidered E. coli cultivation process • PID controller tuning using genetic algorithms • Results and discussion Numerical Methods & Applications 2010
Introduction Commercially available controllers exist only for well established measurement systems as: Bioprocesses characteristics: • highly changing dynamics, which is caused by • per pH • temperature • stirrer speed • dissolved oxygen • etc. • the non-linear growth of the cells • the metabolic changes • the overall metabolism changes GA are capable of handlingproblems with: • non-linear constraints • multiple objectives • dynamic components To achieve good closed-loop system performance GA based controller tuning is proposed. Numerical Methods & Applications 2010
Theoretical background ofthe PID control algorithm Why PID control? • Simple, easy to use • Wide application: • petrochemicals, • pharmaceuticals, • food, • chemicals, • aerospace and semiconductors, • etc. • Robust: insensitive to changes to plant parameters and disturbance Over 90% of the control loops are PID. Numerical Methods & Applications 2010
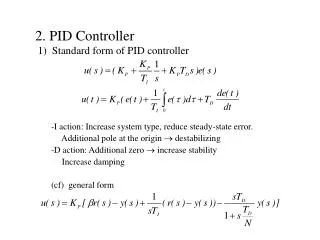
Theoretical background ofthe PID control algorithm Fig. 1. A typical structure of a PID control system Basic control actions: u(t) Proportional mode - (adjustable gain (amplifier)) Integral mode - (eliminates steady-state error, can cause oscillations) Derivative mode - (effective in transient periods, provides faster response (higher sensitivity)) Numerical Methods & Applications 2010
Theoretical background ofthe PID control algorithm • The mathematical description of discrete-time universal PIDcontroller is: where k is the number of sample;u(k) - control signal;up(k), ui(k) and ud(k)- proportional, integral and derivative modes of control signal;r(k) – referencesignal;y(k) - output signal;Kp- proportional gain;Ti- integral time;Td-derivative time;Td/N - time constant of first-order low pass filter;T0 – sampletime;b and c - weighting coefficients. Six tuning parameters - Kp, Ti, Td, b, c and N Numerical Methods & Applications 2010
Description of theE. coli MC4110 cultivation process The mathematical modelcan be represented by the following dynamic mass balance equations: Numerical values of the model parameters used insimulations are: µmax= 0.55 h-1, kS= 0.01 g/l, YS/X= 0.50. The controlleris used to • control feed rate F and •maintain glucose concentration Sat thedesired set point of 0.1 g/l. The optimal value of the PID controllerparameters (Kp, Ti, Td, b, c and N) are found using GA. Numerical Methods & Applications 2010
PID controller tuning using genetic algorithms Initialization of algorithm parameters Table 1. Genetic operators Table 2. Genetic parameters Numerical Methods & Applications 2010
PID controller tuning using genetic algorithms Representation of chromosomes Each chromosome isa sequence of k- parts each of them with n (encoding precision)genes. The range of the tuning parameters is considered as follows: Kp[0; 2],Ti[0; 1], Td[0; 0.1], b [0; 1], c [0; 1] and N [0.001; 1000] After several runs the range for the parameters is specified to: Kp[0.4; 2], Ti[0.005; 1]and Td[0.003; 0.1] Numerical Methods & Applications 2010
PID controller tuning using genetic algorithms Objective function To evaluate the significance of the tuning procedure andcontroller performance four criteria are used: integrated squared error (IISE) integrated absolute error (IIAE) integrated time-weighted absolute error (IITAE) integrated squared time-weighted error (IISTE) The error e is the difference between the set-point and the estimatedsubstrate concentration (Ssp- S). Numerical Methods & Applications 2010
Results and discussion Table 3. Controller parameters, mean value (with noise) Numerical Methods & Applications 2010
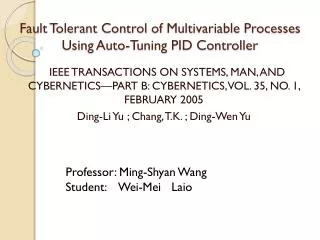
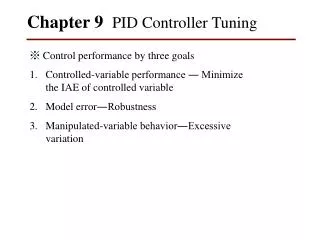
35 30 1 Biomass - this report Substrate control - this report Biomass - Arndt et all. 25 Substrate control - Arndt et all. 0.8 0.6 20 0.4 15 Biomass concentration, [g/l] 0.2 10 Substrate concentration, [g/l] 0 5 -0.2 0 6 7 8 9 10 11 12 13 14 15 -0.4 Time, [h] -0.6 6 7 8 9 10 11 12 13 14 15 Time, [h] Results and discussion Comparison with the results obtained from the controller design of the same cultivation process reported in M. Arndt and B. Hitzmann,2001 a) biomass concentration b) substrate concentrations Fig. 1. Results of controller and process performance concerning Case 2 and IITAE Numerical Methods & Applications 2010
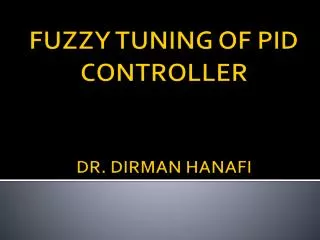
1 Substrate control - this report Substrate control - Arndt et all. 0.8 0.6 0.4 0.2 Substrate concentration, [g/l] 0 -0.2 -0.4 -0.6 6 7 8 9 10 11 12 13 14 15 Time, [h] Results and discussion Numerical Methods & Applications 2010
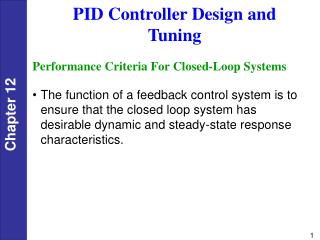
0.8 0.16 Feed rate - this report Substrate control - this report Feed rate - Arndt et all. 0.7 Substrate control - Arndt et all. 0.14 0.6 0.5 0.12 0.4 0.1 Feed rate profile, [l/h] 0.3 Substrate concentration, [g/l] 0.08 0.2 0.1 0.06 0 6 7 8 9 10 11 12 13 14 15 0.04 9 9.1 9.2 9.3 9.4 9.5 9.6 9.7 9.8 9.9 10 Time, [h] Time, [h] Results and discussion c) substrate concentrations between 9 and 10 h d) resulting feed rate profiles Fig. 2. Results of controller and process performance concerning Case 2 and IITAE Numerical Methods & Applications 2010
Results and discussion The maximum difference reported in M. Arndt and B. Hitzmann,2001 is 0.06 g/l. In parallel, the maximum difference achieved here is 0.03 g/l. The resulting standard deviation and mean value concerning control variable are: inthis report σs= 0.0063 ms = 0.0967; in M. Arndt and B. Hitzmann,2001 σs= 0.1513 ms=0.1306. The presented results indicate high qualityand better performance of the designed control system. Numerical Methods & Applications 2010
Thank You ! Numerical Methods & Applications 2010