Download
1 / 27
270 likes | 429 Views
CSAP MGPs by GT vs. Non-GT Students Morey Middle School. Median Growth Percentile. CSAP MGPs by GT vs. Non-GT Students Morey Middle School. Median Growth Percentile. CSAP MGPs by GT vs. Non-GT Students Morey Middle School. Median Growth Percentile.

E N D
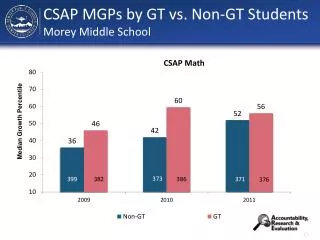
CSAP MGPs by GT vs. Non-GT StudentsMorey Middle School Median Growth Percentile
CSAP MGPs by GT vs. Non-GT StudentsMorey Middle School Median Growth Percentile
CSAP MGPs by GT vs. Non-GT StudentsMorey Middle School Median Growth Percentile
CSAP MGPs by GT vs. Non-GT StudentsArchuleta Elementary School Median Growth Percentile
CSAP MGPs by GT vs. Non-GT StudentsArchuleta Elementary School Median Growth Percentile
CSAP MGPs by GT vs. Non-GT StudentsArchuleta Elementary School Median Growth Percentile
CSAP MGPs by GT vs. Non-GT StudentsCarson Elementary School Median Growth Percentile
CSAP MGPs by GT vs. Non-GT StudentsCarson Elementary School Median Growth Percentile
CSAP MGPs by GT vs. Non-GT StudentsCarson Elementary School Median Growth Percentile
CSAP MGPs by GT vs. Non-GT StudentsCory Elementary School Median Growth Percentile
CSAP MGPs by GT vs. Non-GT StudentsCory Elementary School Median Growth Percentile
CSAP MGPs by GT vs. Non-GT StudentsCory Elementary School Median Growth Percentile
CSAP MGPs by GT vs. Non-GT StudentsEdison Elementary School Median Growth Percentile Data slightly differ from data presented on 8/26/11 due to updates in how GT/Non-GT categories were calculated.
CSAP MGPs by GT vs. Non-GT StudentsEdison Elementary School Median Growth Percentile 87 94 65 67 77 82 Data slightly differ from data presented on 8/26/11 due to updates in how GT/Non-GT categories were calculated.
CSAP MGPs by GT vs. Non-GT StudentsEdison Elementary School Median Growth Percentile Data slightly differ from data presented on 8/26/11 due to updates in how GT/Non-GT categories were calculated.
CSAP MGPs by GT vs. Non-GT StudentsGust Elementary School Median Growth Percentile
CSAP MGPs by GT vs. Non-GT StudentsGust Elementary School Median Growth Percentile
CSAP MGPs by GT vs. Non-GT StudentsGust Elementary School Median Growth Percentile
CSAP MGPs by GT vs. Non-GT StudentsPolaris at Ebert Median Growth Percentile
CSAP MGPs by GT vs. Non-GT StudentsPolaris at Ebert Median Growth Percentile
CSAP MGPs by GT vs. Non-GT StudentsPolaris at Ebert Median Growth Percentile
CSAP MGPs by GT vs. Non-GT StudentsSouthmoor Elementary School Median Growth Percentile
CSAP MGPs by GT vs. Non-GT StudentsSouthmoor Elementary School Median Growth Percentile
CSAP MGPs by GT vs. Non-GT StudentsSouthmoor Elementary School Median Growth Percentile
CSAP MGPs by GT vs. Non-GT StudentsTeller Elementary School Median Growth Percentile
CSAP MGPs by GT vs. Non-GT StudentsTeller Elementary School Median Growth Percentile
CSAP MGPs by GT vs. Non-GT StudentsTeller Elementary School Median Growth Percentile