Download
1 / 20
200 likes | 362 Views
Natural History of Sharks, Skates, and Rays Food & Feeding MARE 394 Dr. Turner Summer 2008. Diet. Widely recognized that elasmobranchs play a role in energy transfer b/w upper trophic levels; understanding of how prey is consumed & processed is rudimentary. Quantifying Diet.

E N D
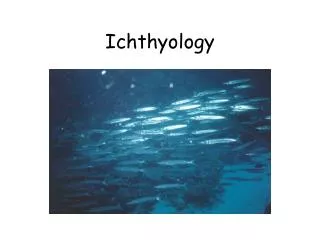
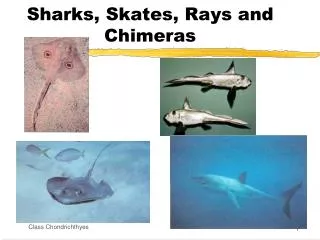
Natural History of Sharks, Skates, and Rays Food & Feeding MARE 394 Dr. Turner Summer 2008
Diet Widely recognized that elasmobranchs play a role in energy transfer b/w upper trophic levels; understanding of how prey is consumed & processed is rudimentary
Quantifying Diet Early descriptions – lists of prey items; counts, weight, or volume of stomach w/specific prey types Later index of relative importance (IRI) = %F(%W + %N) Energy budget of prey; convert items into calories or joules
Dietary Groups 1° carnivores – limited array of prey compared to teleosts; Consume: plankton, teleosts, elasmobranchs, cephalopods, large fishes, reptiles, birds, marine mammals
Diet Shifts That’s right! You fat cats didn’t finish your plankton; now it’s mine! – Chuck Gerebedian Fishing Down Marine Food Webs
Feeding Relationships Relatively few investigations comparing diets of elasmobranchs Typically studies involving niche overlap among elsmo, competition w/ teleosts, among size classes of individual species
Feeding Patterns Understanding feeding patterns requires knowledge of diet and dynamics of the feeding process, including ecological interactions b/w predator & prey Difficult; ↑ # of empty stomachs – no information
Trophic Levels Assumed to be top predators Estimated with models – Ecopath Sharks- tertiary consumers (4th trophic level); similar to marine mammals, > birds Also estimates using 13C & 15N isotopes
Stable Isotopes Carbon and nitrogen generally used (sulfur recently) - Both abundant throughout nature Values expressed as ratios of two isotopes - 13C/12C or 15N/14N = δ Can determine: primary producer (C&S) -Organic material has “isotopic signature” trophic level of feeding (N) Based upon principle of “Fractionation” Each time stable isotope is metabolized there is “Fractionation” (do not participate equally – bias toward lighter)
Fractionation 12C 12C 12C C 13C 13C 13C -20 ‰ -19 ‰ -18 ‰ -17 ‰ Est. Value +1 ‰ +1 ‰ +1 ‰ 14N 14N 14N N 15N 15N 15N +10 ‰ +7 ‰ +13 ‰ +16 ‰ Est. Value +3 ‰ +3 ‰ +3 ‰
13C…origin of organic matter -8 -20 Fractionation of Carbon 1 ppt per Trophic level -9 -21 -10 -22 Phytoplankton Seagrass
15N…Trophic position of consumer Fractionation of Nitrogen 3-4 ppt Per Trophic level 18 tuna & dolphin = unknown 14 12 10 8 6 15 12 Juvenile fishes 15N Crustaceans 9 diatoms 6 -22 -20 -18 -16 13C
Food Consumption Feeding ecology – important aspect of life-history – expressed as food consumption rates Consumption dep. upon gastric evacuation rates
Daily Ration Mean amount of food consumed on a daily basis by individuals of a population – expressed as a proportion of mean body weight; measured: 1) in situ – field method; requires amt of food in stomach, gastric evacuation dynamics 2) bioenergetic models – estimated based upon bioenergetic equation: growth + metabolism + excretion + egestion
Energy Budget Equation Consumption = growth + metabolism + excretion (urine, U) + egestion (feces, F) C = G + M + U + F Daily energy required for growth (J day-1) = growth (g day-1) X energy equiv of shark tissues (J g-1) Metabolism – MR X oxycalorific value Non-assimilated loss ≈ 27%
Evacuation, Excretion, Egestion Limited information regarding gastric evacuation Excretion loses in gill effluent & urine not measured Egestion – spiral value; ↑ SA for digestion, ↓ volume to accommodate large liver
Production Growth in body mass – measured via laboratory exper, field mark-recapture, size-at-age Expressed as % body weight ↑ in teleosts compared with elasmo Gross conversion efficiency (K1)
Gross Conversion Efficiency Gross conversion efficiency (K1) – efficiency of food conversion to somatic growth; measures proportion of digested food available to next trophic level Typically from 3-40%; decrease with age Based upon Assimilation Efficiency- AE
Summary – Food & Feeding Gastric Evacuation & Daily Ration
Summary – Food & Feeding Elasmobranchs: Typically slow to process (digest) Slow growth – even in juveniles Might change with heterothermic pelagics - difference not seen in mako