Download
1 / 40
400 likes | 481 Views
Perform Grow and Breakout. Presentation to JB Were Financial Services Conference Singapore, 6 June 2001 John McFarlane Chief Executive Officer Australia and New Zealand Banking Group Limited. ANZ - who we are. One of the ‘Big Four” Australian banks.

E N D
Perform Grow andBreakout Presentation to JB Were Financial Services Conference Singapore, 6 June 2001 John McFarlane Chief Executive Officer Australia and New Zealand Banking Group Limited
ANZ - who we are • One of the ‘Big Four” Australian banks. • Provider of full range of financial services in Australia (since 1835) and New Zealand (since 1840) • Leadership in Corporate Banking, Credit Cards and Mortgage origination, a strong eCommerce position and an offshore network in Asia and Pacific. • Assets A$181b (US$ 95b) • Market Cap A$20.5b (US$ 11b) • Profit (half year) A$895m (US$ 470m) • Staff 22,815 • Credit Ratings AA-/Aa3 ANZ Headquarters 100 Queen Street Melbourne Note: figures as at 31/3/01
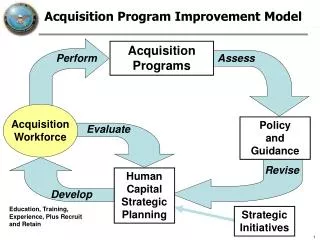
We are on track to deliver on our 3 year commitments Measure EPS growth ROE Cost-income ratio Inner Tier 1 Credit rating 3 Year Commitment > 10% > 20% mid 40’s 6% maintain AA category Achievement 13% 19.1% 49.4% 6.2% maintained • We have also committed to improving customer satisfaction, and will publicly report our progress
Building for the future - a distinctive strategy • Proposition • Entrepreneurial specialists create more value • Corporations must embrace new technologies • Value depends on performance, growth and breaking out • Strategy • Reconfigure ANZ as a portfolio of 16 specialist businesses • An e-Bank with a human face • Drive results, invest in growth businesses and create new paradigms • Implications • Specialist approach to customer and product businesses • Transform the way we do business with IP technology • Meet expectations, fund growth by cost reduction, transform Specialise e-Transform Perform Grow & Break out
Transforming ANZ through Perform, Grow and Breakout • Focus: long term ‘destiny’ • Benchmark: global industry/players • Looking for: transforming moves • Horizon: 5-10 years • Success: dramatic market cap increase Break out • Focus: specialisation and out-growing the market • Benchmark: competitors in each business • Looking for: breakout moves in key • businesses (eg QTV, Origin) • Horizon: 3-4 years • Success: 4-5 moves taking share and • worth ~AUD1bn+ market cap each Grow • Focus: performance • Benchmark: market expectations • Looking for: six monthly delivery • Horizon: 1-2 years • Success: meet/exceed expectations • consistently Perform
We are performing well - interim results • NPAT from continuing operations $907m - up 18% • EPS up 13% to 55.8 cents • ROE of 19.1%, up from 17.8% • Costs flat - cost income ratio down to 49.4% • Credit quality sound: • ELP charge down to 35 bp’s • Total non-accruals down • Specific provisions flat • Profit on sale of holding in St George $99m ($65m after tax), offset by write downs in investments ($84m) • Improved disclosure - financial information provided for each business unit Note: Comparisons are against half year ended March 2000 (including Grindlays)
Internet banking users as % of main relationships Non-accrual loans ...and building a strong track record NPAT/ROE Cost to Income NPAT $m ROE % Source: JP Morgan & Roy Morgan Research
Good profit growth across a diversified portfolio Mar 00 v Mar 01 $m Personal Corporate International and subsidiaries
80% of businesses delivered revenue growth greater than expense growth revenue growth %* ROE Mortgages 50 top third 45 middle third 40 35 bottom third Cards 30 Institutional 25 GCM GSF 20 Asia 15 GFX Pacific GTS 10 General Banking Corporate expense growth %* Small Business 5 Wealth -25 -20 -15 -10 -5 5 10 15 20 25 30 Asset Finance -5 Investment Management -10 -15 *based on pcp
We continue to actively manage and reduce risk Lending Profile by Asset Type* • Exiting higher risk businesses • More emphasis on lower risk businesses • Corporate balance sheet deliberately constrained – focus on fee income • Risk based approach embedded through EVA business consumer * CBA as at 31/12/00, NAB & WBC as at 30/9/00
Total non-accrual loans continue to fall, but increase in Australia Historic Geographic Gross Non-Accrual Loans $m Gross Non-Accrual Loans (LHS) $m Non-Accrual Loans/ Loans & advances (RHS) Net Non-Accrual Loans (LHS) Aust NZ Inter
Provisioning levels remain strong represents 3 years expected losses $m % GP/Lending Assets* ELP charge 241 FX impact 1460 27 1373 (181) Net SP transfer Surplus448 1012 1H 2001 2000 APRA Guidelines ELP - Economic Loss Provision SP - Specific Provision * includes acceptances
We are developing a track record for building growth businesses % % Share of credit card spend Mortgage market share 95 96 97 98 99 00 01 95 96 97 98 99 00 01 m $m % Personal customers - Australia FM inflows(LHS) Deposit market share(RHS)
Most businesses’ targeting revenue growth well in excess of expense growth Personal Cards Corporate High Int. & Subsidiaries GFX Asia GSF Wealth Asset Fin GCM GTS ANZ Investments Pacific Nominal GDP Growth Plan Revenue Growth 01-03 cagr Inst. Bank Small Bus Metro & Reg Banking Mortgages Corporate Cost:Income falling Low ILLUSTRATIVE Low High Plan Operating Expense Growth 01-03 cagr Note: Bubble size in proportion to 2001 Npat
Substantial growth opportunities in Personal • System Growth • Underlying credit growth ~ 8-10% pa • Market Share • Product businesses growing customer numbers and mkt share • Customer #’s increasing by 1.0m - translates to $650m in additional revenue pa • Increase Wallet • Customer businesses deepening wallet share • $650m revenue gain by matching our peers • Created customer businesses • Sales programs • CRM Total potential revenue growth - $1.5b Customer #’s (m) Peer Average Increased wallet on higher share $160m 10 Potential revenue $650m 7.3 5 4 Potential revenue $650m Existing revenue $2.6b 0 40% 50%* Share of Customer Wallet * Average share of wallet for CBA, NAB, SGB, WBC - source: Roy Morgan Research
Our breakout approach is differentiating us • Specialised businesses • First class execution (no surprises) Strategy Staff Customers eTransformation Risk • 91% of managers on individual contracts • 12% rise in staff satisfaction • Establishment of Customer Charter, Customer Advocate and distinctive customer and community initiatives • Leading cost income ratio • Highest internet banking penetration • Leading financial disclosure & transparency • EVA embedded in culture
Developing a breakout performance culture Mission /aspiration where we are where we want to be Distinctive (Top 10%) Targets/goals Superior (Top 25%) Average Organisational approach BU Performance feedback Consequencemanagement Rewards &recognition Opport- unities People Financial Operational Values + Coordination and control Motivation Average Superior Distinctive * Benchmark - 33 Australasian companies surveyed over 1999-2000
Creating a more dynamic working environment % • 91% of managers have signed individual contracts • pc’s@home • tertiary qualifications for managers • 130 staff have commenced eMBA • comprehensive level of share ownership amongst staff
Economic outlook - cautiously optimistic Real GDP Growth incl. and excl. housing and Olympics (est) % Financial conditions in Australia more expansionary than US Contractionary Year ended, excluding dwellings and Olympics Expansionary • Retail sales continue to rebound • Housing recovery continues • But unemployment is still rising • Forecast GDP growth for 2001 calendar year - 2%, rising to 3¾% in 2002 • Unlike the US, Australia did not experience contractionary financial conditions • With domestic growth indicators strengthening, and early signs of rising inflation, interest rate cycle has likely bottomed
ANZ’s aspiration • A high performing company, exceeding expectations • Revenue growth • Cost leadership • Risk mitigation • EPS • ROE • Positioned in growth markets • Actively managed portfolio • Annual investment in growth ideas • Higher than peer revenue growth Perform Grow AND Breakout • More dynamic than competitors • High P/E rating • Performance culture • Lean and agile • The e-bank with a human face • A breakout mentality
Summary • We are performing well • Cost management momentum – eTransformation has just begun… • Risk reduction continues • Our new strategy is creating value andbetter positioning us for growth • We are differentiating ourselves through our Breakout program We are on track to achieve our goals
The material in this presentation is general background information about the Bank’s activities current at the date of the presentation. It is information given in summary form and does not purport to be complete. It is not intended to be relied upon as advice to investors or potential investors and does not take into account the investment objectives, financial situation or needs of any particular investor. These should be considered, with or without professional advice when deciding if an investment is appropriate. For further information visit www.anz.com or contact Philip Gentry Head of Investor Relations ph: (613) 9273 4185 fax: (613) 9273 4091 e-mail: gentryp@anz.com
Supplementary Information 2001 Interim Results and credit quality information
Strong income growth, with good progress across the board $m Profit on sale of St George 65 Write downs (84) Non-Interest Income 76 Expenses (34) Abnormal/ Discontinued Items 104 Provisioning (14) Interest Income 84 Tax (12) 930 Discontinued (12) 907 895 Eftpos NZ acquisition and GST ($26m) 826 2H 2000 2H 2000 Continuing 2001 1H Continuing 2001 1H
“Unusual” items – St George profit offset by write downs in investments • St George - $99m profit ($65m after tax) • regulatory issues - not critical to strategy • attractive price Panin Share Price IDR • Panin - $43m writedown# • long term growth prospects remain positive • E*Trade - $21m writedown# • online broking service provides core customer offering • Other - $20m writedown# • a number of small eCommerce related investments $ E*Trade Share Price # - no tax relief on these writedowns
Income drivers* % Margins stabilised in first half • Benefit from differential between 90d BBSY and cash rate • Greater focus on improving margins Other Non-interest income continues to grow Trading FX • Driven by higher non-lending fee income • FX profits higher, reflecting AUD volatility Other Fees Lending Fees * For continuing businesses
Cost-income ratio on track to meet target of mid 40’s $m CTI Sale of Grindlays • Reduction in Cost Income ratio driven by revenue growth and cost control • Approximately $65m of restructuring provision used • two year program, with benefits principally 2002 and beyond • eTransformation will continue to drive costs down
Personal portfolio • Mortgages and Cards reinforce value of our specialisation strategy • Clear opportunities for customer businesses to replicate success of product businesses • Significant market share growth opportunities remain • creation of Metrobanking and Regionalbanking • a 1% increase in market share for customer businesses worth $100m+ revenue $m
Corporate portfolio – fee income driving profit growth • Five of six businesses delivered profit growth greater than 10% • “Non-traditional” income for Corporate Banking grew 40%+ on annualised basis, largely by executing Wall St to Main St strategy $m
International & Subsidiaries – risk reducing, profits up • Asset Finance reconfiguring back office platform to deliver substantial efficiencies • Negative profit growth for Investment Management due to tax changes and increased growth spend • Asia showing positive signs, on track to record significant profit growth for the full year Asian Credit Quality AAA to BBB+ BBB to BBB- BB- BB+ to BB B to CCC Non-accrual
Capital management will continue • Capital Management • Philosophy: • Maintain capital consistent with ANZ’s AA status and peer group ratings • Tier 1 (6.5 - 7.0%) • Inner Tier 1 (6.0%) $b % 7.9 7.7 7.5 7.4 7.3 6.9 • Progress • $413m in share buybacks in the half year • New framework for allocating capital for operating risk implemented • Capping of DRP/BOP 6.7 6.5 6.4 6.2
Arrears analysis indicates no systemic deterioration % personal lending assets over 60 days in arrears % % Personal Loans Business FDAs Credit Cards Housing Loans RILs* Overdrafts • Increase in credit card arrears reflects seasonal influences • Personal loan arrears continue to increase in % terms due to reducing book • Small upturn in arrears in Jan-Feb largely reversed during March • Arrears broadly in line with same period last year * Residential Investment Loans
Corporate book holding up well, despite a few one off “issues” Corporate risk grade profile • Risk actively managed • Quarterly strategy reports prepared for all high risk accounts • June to October 2000 - all BB rated accounts within Corporate reviewed in expectation of downturn • New accounts > $3m to be referred “one level higher” AAA to BBB+ BBB to BBB- BB + to BB BB- > B >B = B, B-, CCC & non-accrual
Credit quality is sound in some of our larger industry exposures - Australia x Lending Assets (AUDm) % of Portfolio (RHS scale) % in CCR 7D-8G (RHS scale) % in CCR 9-10 (RHS scale) Manufacturing Retail Trade Real Estate Operators & Dev. Accomm. Cafes & Restaurants Construction Agriculture
Group risk grade profile continues to improve $114.6bn $126.5bn $134.9bn $141.0bn AAA to BBB+ BBB to BBB- BB + to BB BB- 5.4% 3.9% > B 7.2% 3.8% ELP (bp’s) 45 43 38 35 • Risk grade profiles by division and geography in appendix >B = B, B-, CCC & non-accrual
$m Actual SP v ELP charge ELP charge SP charge Personal Corporate Int & Sub. Current provisioning in line with expectations • ELP is a function of volume (on and off balance sheet), risk grade profile, and level of security • Specific Provisions tend to be less volatile in Personal businesses and track more closely to ELP
ANZ is different….. Lending assets by asset type Total assets by geography A$b A$b • We were • Reliant on market trading earnings • Higher risk asset base, particularly emerging markets • Prone to adverse surprises • Today • Developing specialist businesses from distinctive capabilities • Australasian, with regional interests • Strong consumer growth engine balancing leading position in Corporate * as at 31 March 2001
Economic Loss Provisioning GP % net lending assets Actual Losses are funded from the General Provision ELP Charge = Loan Amount x Probability loss x Loss Given default Plus General Provision balance Actual SP’s P&L Charge An adjustment to ensure the GP balance is sufficient to cover: • Volatility around expected loss (using statistically quantified variance) • Remaining term of loan portfolio • Balance sheet growth • ELP charge will vary from year to year based on: • changes in lending volumes • change in risk grade profile • security levels • product and geographic mix
Summary of forecasts - Australia Calendar years 1999 2000 2001 2002 Real GDP growth 4.7 3.7 1¾ 3¾ Inflation 1.5 4.5 4.0 1½ Unemployment (Dec) 6.7 6.2 7.0 6 ¾ Current account deficit (%GDP) -5.8 -4.0 -2.3 -3.3 Housing starts (‘000) 157 147 123 135 90-day bill yield (% pa, Dec) 5.48 6.20 4.75 5.1 10-year bond yield (% pa, Dec) 6.64 5.50 5.9 6.2 A$ (US cents, Dec) 65.8 55.8 55.0 62.0 Sources: ABS; RBA; Economics@ANZ.
Outlook • System credit growth forecasts* • housing 12.4% • personal 11.1% • business 6.5% • Personal to exceed system credit growth • Corporate credit growth - continuing higher quality focus • Margin compression will continue • Costs flat • Challenges ahead, however we are well placed to continue to perform well, and achieve our targets over the medium term * forecast for year ending 30 September