Download
1 / 10
100 likes | 282 Views
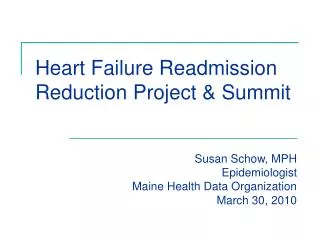
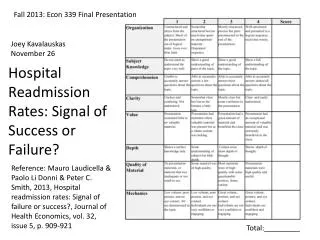
Fall 2013: Econ 339 Final Presentation. Joey Kavalauskas November 26. Hospital Readmission Rates: Signal of Success or Failure?.

E N D
Fall 2013: Econ 339 Final Presentation Joey Kavalauskas November 26 Hospital Readmission Rates: Signal of Success or Failure? Reference: Mauro Laudicella & Paolo Li Donni & Peter C. Smith, 2013, Hospital readmission rates: Signal of failure or success?, Journal of Health Economics, vol. 32, issue 5, p.909-921 Total:_________
Hospital Readmission Rates:Signal of Success or Failure? Joey Kavalauskas
Abstract • Outcome-based quality indicators used as signals of hospital performance • Unexpected readmission rates aim to measure poor quality of care • Used as a basis for hospital reimbursement • Designed to promote improvement • Hospitals with low mortality rates likely to have a larger share of unobservable sick patients at risk of readmission
Model • Reduce uncertainty by isolating a population -Fractured hip in patients 65 and older -290,000 patients in years 2003-2008 • Chosen for of its extensive documentation, and high risk of mortality and readmission • Relax assumption of independence between mortality and readmissions
Model • Unplanned readmissions identified as emergencies within 28 days of last discharge • Measure patient health on Charlson comorbidity index • Also include a variable counting the total number of any secondary diagnosis included after first admission • Control for external factors such as socio-economic status, distance from hospital
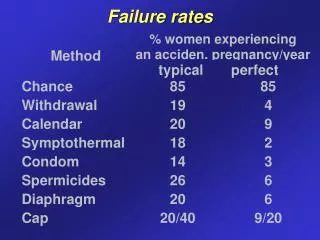
Descriptive Statistics • Average age 83.3 years • 77% women because of bone fragility and prevalence of osteoporosis • Patients have an average of 5 other diagnoses • Procedures – fixation (42.7%), prostatic fixation (37.5%), no procedure (15.2%)
Discussion • Patient’s health conditions are not perfectly observable = inadequate risk adjustment • Hospitals with high survival rates more likely to have patients at higher risk of readmission • Performance in readmissions determined by quality of care • Hypothesis: high quality hospitals with high survival rates have higher readmission rates
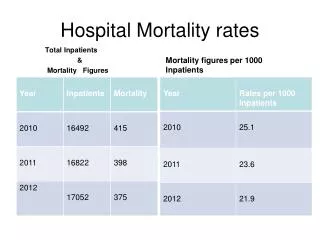
Trends in mortality and readmission • Positive correlation between survival rates • and readmission
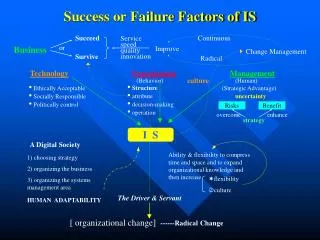
Conclusion • Positive correlation suggests better performance in survival = worse performance in readmissions • Correlation between data generating process of survival and readmission corrupt inference on readmission for procedures • Simple test for residual correlation between survival and readmission prove valuable
Conclusion • Conventional indicators of quality do not account for selection bias • Unwarranted pressure on good hospitals and ignoring the weak • Hospital readmissions to rise with falling mortality rate • Developing more analytically accurate measures of performance