Download
1 / 1
10 likes | 100 Views
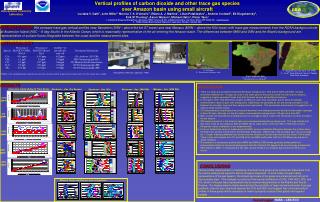
Study comparing gas profiles near Santarem & Manaus with data from Ascension Island. Results show significant differences in gas levels, highlighting the need for further vertical profiling to understand global and regional gas budgets.

E N D
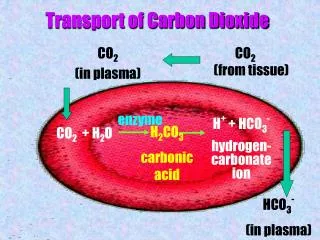
Vertical profiles of carbon dioxide and other trace gas species over Amazon basin using small aircraft Luciana V. Gatti1, John Miller2, Monica T. S. D’Amelio1, Elâine A. J. Martins1, Lilian Polakiewizc1,, Andrew Crotwell2, Ed Dlugokencky2, Kirk W Thoning2, Aaron Watson2, Michael Hahn2, Pieter Tans2 1 - Instituto de Pesquisas Energéticas e Nucleares (IPEN), Travessa R, 400, Cidade Universitária, São Paulo, Brazil, CEP: 05508-900 . lvgatti@ipen.br 2 - NOAA Climate Monitoring and Diagnostics Laboratory, Boulder, Colorado USA Ascension Island (8 deg S) Time Series Santarem – Asc. Dry Season Santarem – Asc. Wet Season Santarem – Asc. 2005 Wet CO2 (ppm) DISCUSSION • There is a large and consistent enhancement above background in CH4 at both SAN and MAN. Surface enrichment between 50 -100 ppb are seen in the lower parts of the profiles in both the wet and dry seasons, suggesting roughly equivalent fluxes from both biomass burning and wetland emissions. • In contrast to CH4, CO2 differences (mainly at SAN) are much less consistent, but do show an average enhancement of about 2 ppm over background. Additionally, we generally do not see strong contrasts in CO2 between the boundary layer and the overlying free troposphere. This wet-season enhancement is suggestive of a regional-scale surface source. • CO measurements surprisingly show strong enhancement over background even during the wet season (average of about 40 ppb), although our few dry season measurements average about 100 ppb more than ASC. • N2O sources are enhanced over background by an average of about 1 ppb in the wet season, but also 0.5 ppb in the dry season. • SF6 measurements at in the Amazon basin are somewhat elevated above background. This may indicate that that some of the air we sample at SAN and MAN has its origin further north than ASC or that there is some Amazonian urban contribution to our measurements. • From our limited time series of measurement at MAN, we see substantial differences between the profiles above the K34 tower and the remote site to the Northeast of Manaus. Differences in the boundary layer can be as large as +/- 5 ppm, indicating different local source and sink impacts on the two sites that are only about 100 km apart. There is also not evidence from CO and SF6 at the two MAN profile sites, that the CO2 differences are due to urban influence. • A comparison of wet season profiles above MAN and SAN for 2005 shows generally similar patterns of enhancement relative to the marine background, but both CH4 and CO appear to be more strongly enhanced at SAN relative to MAN. In comparing the two sites, we are limited in our analysis due to the short time of our record. CO (ppb) CH4 (ppb) N2O (ppb) SF6 (ppt) Atmospheric Chemistry Laboratory INTRODUCTION: We compare trace gas vertical profiles near Santarem (SAN – above the km 67 tower) and near Manaus (MAN – above the K34 tower) with trace gas measurements from the NOAA background site at Ascension Island (ASC -- 8 deg South) in the Atlantic Ocean, which is reasonably representative of the air entering the Amazon basin.The differences between MAN and SAN and the Atlantic background are representative of surface fluxes integrated between the coast and the measurement sites. METHODOLOGY A – K34 Tower B – Remote area, Amazonas state 1- Impacted area (02º 52'S, 54º 41'W) 2 – km 67 Tower,National Forest of Tapajós, Pará State, Santarém Atmospheric Chemistry Laboratory - IPEN *Stability is the standard deviation found for the same tank call measured for all gases one time per week, since the system was installed. Brazil Vegetation Map Embrapa Monitoramento por Satélite, 2004. <http://www.cdbrasil.cnpm.embrapa.br>. RESULTS Manaus – Asc. 2005 Wet CONCLUSIONS Vertical profile measurements of radiatively important trace gases show substantial differences from the marine background signal for almost all gases measured. In most cases (though mainly representative of the wet season), the Amazonian levels of the gases are enhanced and not just in the boundary layer. This changes our picture of the tropical distribution of CO2, CH4, N2O, SF6, and CO, which in the past were represented only by marine measurements in the Atlantic and Pacific Oceans. Our measurements clearly demonstrate the possibility of large marine/continental trace gas gradients, even for very long-lived species like CO2 and N2O, and suggest that continued vertical profiles of these gases will be necessary in order to properly constrain their global and regional budgets. Manaus Tower and Remote area comparison Financial supportNASA – LBA-ECO