1 / 3

Analysis of 3rd Semester Failure Rate: Graph of Pass and Fail Students by Subject

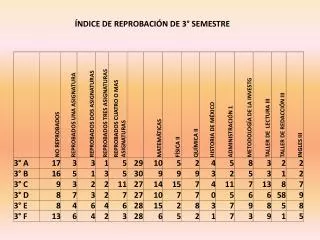
This study presents a thorough examination of the failure rate in the 3rd semester, displaying a visual representation of students who passed and failed each subject. By analyzing this data, educators can identify areas that require improvement and implement strategies to support struggling students effectively.

fadhila
Download Presentation

Analysis of 3rd Semester Failure Rate: Graph of Pass and Fail Students by Subject

An Image/Link below is provided (as is) to download presentation Download Policy: Content on the Website is provided to you AS IS for your information and personal use and may not be sold / licensed / shared on other websites without getting consent from its author. Content is provided to you AS IS for your information and personal use only. Download presentation by click this link. While downloading, if for some reason you are not able to download a presentation, the publisher may have deleted the file from their server. During download, if you can't get a presentation, the file might be deleted by the publisher.

E N D

More Related