Download
1 / 4
40 likes | 206 Views
AtPK19 [ Oryza sativa ]. RPS6K [ Oryza sativa ]. AtPK19 [ Zea mays ]. RPS6K [ Zea mays ]. LS6K1 [ Lilium longiflorum ]. RPS6K [ Asparagus officinalis ]. ATPK19/ATPK2 [ Brassica rapa ]. ATPK6 [ Arabidopsis thaliana ]. ATPK19 [ Arabidopsis thaliana ]. S6K2 [ Homo sapiens ].

E N D
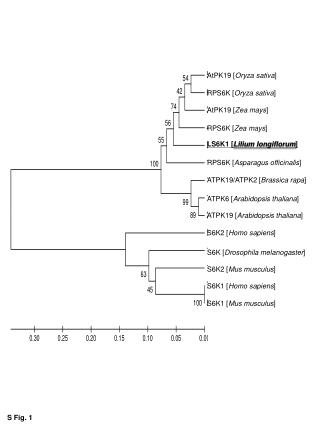
AtPK19 [Oryza sativa] RPS6K [Oryza sativa] AtPK19 [Zea mays] RPS6K [Zea mays] LS6K1 [Lilium longiflorum] RPS6K [Asparagus officinalis] ATPK19/ATPK2 [Brassica rapa] ATPK6 [Arabidopsis thaliana] ATPK19 [Arabidopsis thaliana] S6K2 [Homo sapiens] S6K [Drosophila melanogaster] S6K2 [Mus musculus] S6K1 [Homo sapiens] S6K1 [Mus musculus] S Fig. 1
Supplementary Fig. 1 Phylogenetic analysis of orthologs of the p70s6k genes. Based on the amino acid sequence of the full-length protein, LS6K1 was closely related to p70s6korthologs of rice and maize in monocotyledonous subgroup of plants. The names of the LS6K protein is in bold and underlined. Names of the species for each p70s6k gene are listed behind the protein names. Amino acid sequences of p70s6korthologs were retrieved via the NCBI server (http://www.ncbi.nlm.nih.gov/). The tree was generated by the DNA Data Bank of Japan (http://www.ddbj.nig.ac.jp/), whereas the distance was calculated based on the CLUSTALW using the phylogenetic tree software TreeView. Numbers on major branches indicate bootstrap percentages for 1000 replicate analyses. S Fig. 1
(A) P3X P3-2 AP35’-CTCTAGACATCTCTCTCTTTCTATTTCACTTCTTTCTTCTCAT--- // --- ATG ---- // -----TAA -------3’ PI5’-CTCTAGATGCTCCTCTTCTTGTTCTTCATATAAACCACATATCCTCTCCTCCAT--- // --- ATG --- // -----TGA --3’ SUP5’-CTCTAGATCTCTCTCTCTCTCTCTAAGAGA --- // --- ATG ---------------------------- // -----TAA -----3’ PIX PI-2 SUX SU-2 (B) SUX + SU-2 P3X + P3-2 PIX + PI-2 Marker 1000 809 800 700 770 500 300 200 400 309 S Fig. 2
Supplementary Fig. 2 Confirmation of oligopyrimidine tract sequences in the 5' untranslated region of AP3,PIand SUPcDNA. (A) Forward primers contained oligopyrimidine tract sequences for these three genes (P3X for AP3, PIX for PI, SUX for SUP) and reverse primers in the 3’ ORF (SU-2 for SUP) or 3’-UTR (P3-2 for AP3, PI-2 for PI) were used in RT-PCR analysis (Supplemental Table 1). (B)DNA fragments amplified for AP3 (809 bp), PI (770 bp) and SUP (309 bp). S Fig. 1