Download
1 / 26
260 likes | 390 Views
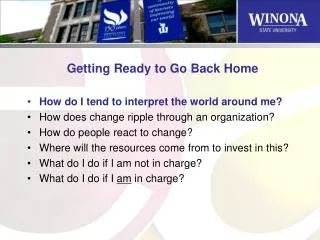
GRAPHING. GO BACK TO ACTIVITY SLIDE. GO TO TEACHER INFORMATION SLIDE. 6. To move from one activity to the next, just click on the slide!. OR CLICK ON A BUTTON TO TAKE YOU DIRECTLY TO AN ACTIVITY. 1. 2. 3. 4. 5. 6. 7. 8. 9. GRAPHS-MAKE YOUR OWN!.

E N D
GRAPHING GO BACK TO ACTIVITY SLIDE GO TO TEACHER INFORMATION SLIDE 6 To move from one activity to the next, just click on the slide! OR CLICK ON A BUTTON TO TAKE YOU DIRECTLY TO AN ACTIVITY. 1 2 3 4 5 6 7 8 9
GRAPHS-MAKE YOUR OWN! • In groups of three or four, decide on a topic your group will survey. (ie..favorite pizza topping) After deciding, check with your teacher for approval before going on.
Create a survey having one or two on the team go around the classroom to survey each person (including the teacher!) When the data is complete, organize it as a team and record the data in your Math Journals. GRAPHS-MAKE YOUR OWN!
GRAPHS MAKE YOUR OWN! • Now you will be displaying the information on some type of graph. No bar graphs or line graphs! Come up with a creative way to show your information.
GRAPHS MAKE YOUR OWN! • Record three summary statements about your graph and write three questions that could be answered using your graph data.
GRAPHS The Handshake Problem • Let’s suppose you shook hands with everyone in this class. How many handshakes would there be? Act it out in your class, starting with one person and filling in the table on the next slide as you add people.
GRAPHS The Handshake Table # of People # of Handshakes # of People # of Handshakes 1 0 2 1 3 3 1 0 2 1 3 3
GRAPHS The Handshake Table 1 0 2 1 3 3 4 6 5 10 6 15 7 21 8 28 # of People # of Handshakes # of People # of Handshakes 1 0 2 1 3 3
GRAPHS Handshake Table • Do you see a pattern in the table after 10 people in class have shaken hands? • Copy at least two different patterns you see in your journal. • Describe the pattern in words. • Can you predict the number of handshakes there might be for 20 people by using the pattern you found? • Click here for the answer! 190 Handshakes
# of HANDSHAKES 0 2 4 6 8 10 12 14 16 18 20 22 24 26 28 30 0 1 2 3 4 5 6 7 8 9 10 11 12 13 14 15 16 17 18 19 # of People GRAPHS Using the data from the Handshake Table, make a line graph showing the number of handshakes there were in your classroom.
# of HANDSHAKES 0 2 4 6 8 10 12 14 16 18 20 22 24 26 28 30 0 1 2 3 4 5 6 7 8 9 10 11 12 13 14 15 16 17 18 19 # of People GRAPHS Using the data from the Handshake Table, make a line graph showing the number of handshakes there were in your classroom.
GRAPHS LEVEL OF WATER Five events happened one night in your bathtub that caused the level of water to rise and fall. Write a creative story telling what might have happened at each blue dot. TIME You will be sharing your story with the class!
GRAPHS LEVEL OF WATER For example ....I jumped into the tub last night and my little brother followed me in! I yelled for mom and she took him out…clothes and all! I was having a great time being a submarine.when suddenly……… TIME
A H C B E F D G GRAPHS 1. What letter appears inside the triangle only? 2. What letter appears inside the circle only? 3. What letter appears inside the rectangle only? 4. What letter appears inside the triangle and circle only? MORE QUESTIONS
A H C B E F D G GRAPHS 5. What letter appears inside the triangle and rectangle only? 6. What letter appears inside the circle and rectangle only? 7. What letter appears inside the circle, the rectangle, and the triangle? 8. What letter appears inside none of these?
GRAPHS A H C B E F D G 1. A 2. C 3. G 4. B 5. F 6. D 7. E 8. H
= one student GRAPHS 4th Grade Favorite Pizza Toppings Write a mathematics story problem using information from the Venn Diagram. Ask a question at the end of your story problem. Then solve the problem. cheese pepperoni hamburger
GRAPHING A survey shows that 9 people like only ketchup on their hamburger, 4 people like only mustard and 5 people like both ketchup AND mustard. Draw a Venn Diagram in your Math Journal that shows the results of this survey. How many people were in the survey? What if a new person showed up and they didn’t like anything on their hamburger? Where would you put them?
GRAPHING 9 + 4 + 5 + 1 = 19 people in the survey KETCHUP MUSTARD
GRAPHING A survey in Miss Magoo’s 4th grade classroom shows that 6 students owned dogs, 5 students owned cats, 2 students had a cat AND a dog, and 3 children had no pets at all! Draw a Venn Diagram that shows the results of this survey
GRAPHING CAT DOG
12 10 8 6 4 2 0 GRAPHING Count the number of angles in each pattern block and show this information on a bar graph. Number of Angles
GRAPHING 12 10 8 6 4 2 0 3 6 4 4 Number of Angles
GRAPHS THAT’S ALL FOLKS! HOPE YOU ENJOYED OUR ACTIVITIES. You’ve plotted your way through graphs, so now you can say, “Venn there, done that!”
Online Math TEACHERS We have included buttons on this page that will get you to each section of skills. Just click on the button and it will take you directly to the first page of the section. The last page of each skill section will bring you back to this page. Just click on the little house button. PATTERNS GRAPHING GEOMETRY FRACTIONSmeasurementPROBLEM DECIMALS SOLVING
GRAPHS Graphing is a way to present data in a concise and visual way that makes it possible to see relationships in the data more easily. In order to learn to interpret graphs and use them a a problem solving tool, children benefit from first making their own graphs.. This experience should be provided at all grade levels. The first activity asks children to go through the whole process of collecting and organizing data, and then a variety of graphs are presented to analyze.