Download
1 / 28
280 likes | 440 Views
Approaches to health Facility Data Collection and Mapping. Bolaji Fapohunda, PhD. Dai Hozumi, MD, MPH JSI, Inc 29 March 2006. Acknowledgement. Dai Hozumi

E N D
Approaches to health Facility Data Collection and Mapping Bolaji Fapohunda, PhD. Dai Hozumi, MD, MPH JSI, Inc 29 March 2006
Acknowledgement Dai Hozumi for the presentation given the 2005 Mini MAQ University, in collaboration with Bolaji Fapohunda. That work is the source document for many of the Slides in this presentation
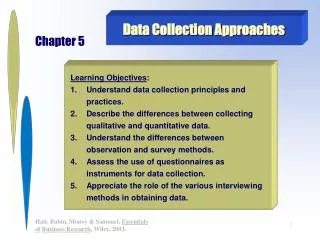
Objectives of this session • Discuss the role of health facility mapping in strengthening health service delivery • Disseminate key approaches to HF mapping, including advantages and disadvantages of specific approaches
Presentation outline • Role of health facility mapping/assessment: • What is it, what it does and what does not do • Differences between health facility mapping and population based surveys • Key approaches to health facility mapping: • Service Availability Mapping (SAM) • Service Provision Assessment (SPA) • Health Facility Census (HFC) • VCT and PMTCT mapping • Conclusion
Definition • Facility: Any site where clients receive formal sector health services • May includes temporary sites/outreach service sites • Includes stand-alone VCT; maternity homes; hospices • Includes private doctor offices (limited availability of information thus far) Source: Fronczak, Nancy. 2006
Why collect data on HF • Huge investments in the formal health sector: • Construction and infrastructure development • Procurement of equipment and supplies • Procurement of medicines • Training • Pilot projects to strengthen service delivery and systems (for specific services) Source: Fronczak, Nancy. 2006
What are the key questions answered by HF data? • Quantity and availability of services • Where are the service delivery points? • What services available? • In what quantity/frequency? • How many health workers are working? • Quality of services • Is there a standard of care guidelines? Are they being used? • Are health workers adhering to the guidelines? • Support mechanism • Condition of building • Availability and condition of equipment • Availability of supplies • Management systems and practice
Pathway to Child Survival: Pediatric HIV/AIDS (adapted from Waldman & Bartlett, 2000) Safest feasible infant feeding Mother provides safest/feasible IYCF, Vit A & Zinc suppl. Infant is HIV positive Mother recognizes signs and symptoms Wellness INSIDE THE HOME Mother continues to give safest/feasible IYCF, Vit A & Zinc supplementation Improved child health Provider gives appropriate HIV/AIDS care & Rx based on need &/orclinical staging community- based treatment/care Growth monitoring CTMZ Micronutrients Water/ sanitation ART adherence counseling Mother seeks care & counseling for signs and symptoms OUTSIDE THE HOME Facility-based treatment/care Provider gives appr. HIV/AIDS care & Rx. Referral Level care Mother accepts referral
Key questions answered by Population-based surveys • What proportion of the population is using services? • What is the characteristics of individuals/ households who are using services vis-a-vis those who are not? • What are the key facilitating and constraining factors to service utilization? • What are the socioeconomic differences in morbidity and mortality levels? • How are health outcomes impacted by access to services?
Advantages of HF data • Contribute to health system strengthening • Important component of the national HIS • Increase the domains of data for investigation, making triangulation possible • HF data can help determine whether population based surveys are necessary, saving costs (e.g. the IMCI-MCE Survey).
Characteristics of system strength affected by HF mapping • Provisions of basic services • Well integrated & complementary services: public/private, static/outreach, different levels: (pry, secondary, referral) • Efficient use of facility resources, including personnel, infrastructure, equipment, supplies and time • Existence of coordinating mechanisms among key levels and programs: outreach departments, community workers etc • Ownership by, & support for, national/community counterparts • RHIS/monitoring & evaluation systems
Key approaches • Service Availability Mapping(WHO) • Service Provision Assessment (ORC Macro/USAID) • Health Facility Census (JICA) • Facility Audit of Service Quality (UNC/USAID) • VCT and PMTCT Mapping
Estimated cost of capital investment requirement for Malawi 2004 - 2009
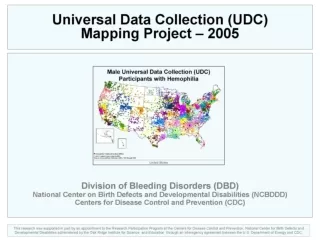
Displaying HF data May display data using simple basic maps or advanced maps
Basic versus advanced mapping: • dot map or shaded polygon map; displays simple patterns and geographic dispersions. • Choropleth, or shaded polygon maps can also be a valuable way to display geographic data. • Software requirements for basic mapping: EpiMap, SIGEpi (produced by PAHO), Healthmapper (WHO) as well as • ArcGIS. Source: Spencer, John. 2006
Advanced Mapping: key is that data is explored in greater depth to produce fuller understanding of the geographic patterns. Require more sophisticated program such as ArcGIS, and additional training. • Basic mapping may be transitioned to more advanced mapping if relevant information is available and there is adequate planning at the start of the Project Source: Spencer, John. 2006
Contact • Bolaji Fapohunda: bfapohunda@jsi.com • Dai Hozumi: dhozumi@jsi.com