Download
1 / 19
190 likes | 212 Views
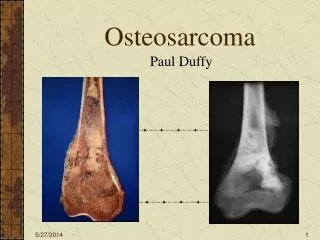
Whole Slide Image Stitching for Osteosarcoma detection. Colaborators : Bogdan Armaselu and Harish Babu Arunachalam University of Texas at Dallas John-Paul Bach, Kevin Cederberg, Dinesh Rakheja , Anita Sengupta , Stephen Skapek and Patrick Leavey UT Southwestern. Ovidiu Daescu.

E N D
Whole Slide Image Stitching for Osteosarcoma detection Colaborators: Bogdan ArmaseluandHarish BabuArunachalam University of Texas at Dallas John-Paul Bach, Kevin Cederberg, Dinesh Rakheja, Anita Sengupta, Stephen Skapek and Patrick Leavey UT Southwestern OvidiuDaescu
Topics of presentation Digital pathology Whole Slide images (WSI) Image Stitching for WSI Image Stitching algorithms Problem Statement Architecture The algorithm – Quad detection Seamless image stitching Results Future work
Digital Pathology Digital pathology is the organization, management and analysis of pathology information through digital images Images are large-resolution Processing is computationally complex due to size of image Image courtesy: Kothari S et al.
Whole Slide Images (WSI) • High magnification images of cells and tissues • Usually 20x or 40x times magnification • Each image is made of number of tiled images • There are very few open vendor image formats • Uses • Education, Research, Tele-pathology, Tele-consultation
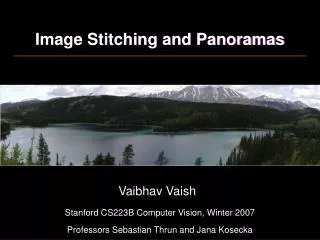
Image Stitching for WSI • Why is image stitching important ? • Helps in pathological image reconstruction • Gives a holistic view of slides under study • Helps to understand the bigger picture of the specimen • Helps to perform analysis on the gross image cumulatively.
Image stitching algorithms – till now Require fixed dimensions of images Use color gradients, average pixel methods for matching (Ma et al.) Certain algorithms work with only fixed orientations (Gallagher et al.) Template image and image slides have same color gradients Very susceptible to noise in image slides
Problem Statement • Given: A template image of an unprocessed bone, a set of WSIs • To do: To reconstruct an image of WSIs using the template image • Helpful parameters: The images are JPEG, image names belong to a specific naming order • Typical Challenges • Template image and WSIs have different color gradients • Presence of artifacts • Orientation issues • Presence of noise in the form of inks, blurry images • Presence of large white margins • Dimensions of WSIs are not consistent
The Algorithm There are two phases for the algorithm • Quad generation <Input: gross image> • The gross image is run through Canny edge detector and grid lines are identified • The output image is then axis aligned using Hough transform and quads are generated • Seamless image stitching <Input: WSIs, Quad file > • The WSIs are then subjected to pairwise correlation using quads value • Stitching is performed based on pairwise gradient matching and canvas rendering through Coordinate maps
Quad generation (1/3) • Input: Gross image containing dark lines representing slicing boundaries • Output: Quad data file • The quads data are generated as follows • The gross image is run through Canny edge detector to generate the grid lines. • A Gaussian filter of (kernel width 5) is used to remove crooked/ skinny lines that are of less significance. • A color gradient of 60 is used to remove false positives and gray out colors less than threshold value
Quad generation– cont’d(2/3)… • This image is the input for the Hough transform, to estimate the angle of tilt of gross image with axis. • H( r, θ) is the number of points on a line L( r, θ) such that ‘r’ is the length of the line L from the origin O • The most common angle of the lines in image is estimated as θ* • The gross image is rotated by an angle of θ* so that the image is axis aligned • Post processing Steps • Edge detection algorithms detect bone margins as edges and hence lines greater than threshold L = 2*sqrt(WxH) are selected. • Lines with distance greater than L/2 = sqrt(WxH) pixels are discarded to remove false positives.
Quad generation - cont’d (3/3)… • Computing quads • All the grid lines computed in previous step are sorted, horizontal lines by X coordinates and vertical lines by Y-coordinates. • An intersection of the horizontal and vertical lines yield bounding boxes of X,Y, Width, Height • They are then written into a quad file as <WSI name, X, Y, width, height> • The WSIs are numbered in lexicographical order from left to right and their position in gross images are computed in non-decreasing order
Seamless Image Stitching • Input: WSI files and Quad data file • Output: Seamlessly stitched final image • The image stitching is performed as follows • Image rotation based on pairwise correlation • Seamless image stitching based on pairwise gradient matching • Image rendering through coordinate mapping and transformation point
Seamless image stitching • Image rotation based on pairwise correlation • Two images Ri and Rj are rotated to find the best match. • The following pairwise calculation is used on each pixel of Ri and Rj within window ‘w’
Seamless image stitching – cont’d (2/3) • For each of the WSIs in the dataset, the best pairwise gradient Gi and Gj is found • The best matching index for each row is computed for each row and each column • Image rendering through coordinate mapping and transformation point • Based on the quads data, a coordinate map is populated • Each image is rendered by iterating the coordinate map
Seamless image stitching – cont’d (3/3) • The images might suffer from noise and blurred regions which might affect image stitching. • In case the gradient calculation is same for two images, the image orientation might be wrong • Such incorrect image rendering is corrected manually by calculating transformation points from quad record, QR • Coordinates are calculated based on the following condition • The transformation point of rotation is retrieved as follows
Some results O/P Seamless stitching in Java application Gross image WSIs All data were JPEG images, taken from UTSW Osteosarcoma patient database. All images are from positive cancer samples. We have 98% accuracy on the datasets we used. Results are as follows Seamless stitching in HTML/JS application
Future work • Extend the application for SVS and Big-Tiff images • Perform image analysis on SVS images. • pixel-based, object-based and semantics-based segmentations • Build knowledge base and learn Cancer Regions of Interest(ROIs) using Machine Learning techniques: predictive modelling, clustering • Build a sliding window application for selective analysis
Thank you! Questions welcome