Download
1 / 3
30 likes | 32 Views
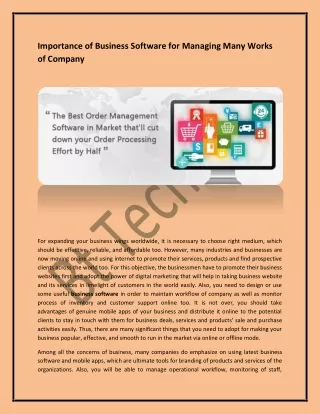
To grow businesses, it's necessary to identify the problems and resolve them with effective measures. Business management consultants help all types of firms by using the seven fundamental quality tools for managing products and services. The 7QC tools are the prime quality tools that help to solve business problems through effective procedures.

E N D
MODELLE Home Contact Importanceof7QCToolsforManagingFirms Importanceof7QCToolsforManagingFirms · August10,2022 businessconsultant Managingabusinessisnotaneasyjob.Fromtimetotime,businessesfaceseveralproblems.It'scrucialto resolvetheseissuesthroughpropertools.The 7QCtools aretheprimequalitytoolsthathelptosolvebusiness problemsthrougheffectiveprocedures. So,whatarethesesevenfundamentalqualitytools? ??ScatterDiagram ??ControlChart ??Histogram ??CauseandEffectDiagram ??ParetoChart ??Stratification ??CheckSheet AccordingtoJapaneseprofessorandtheoristKaoruIshikawa-95% ofallquality-relatedproblemsinafactoryor abusinesscanbesolvedwiththehelpoftheseabovesevenfundamentalqualitativetools.Let'slearnindetail aboutthesevenqualitycontroltools. Importanceof7QualityControlTools 1.ScatterDiagram Thediagramisbasicallyagraphicalrepresentationoftwovariables,oneonthex-axisandanotheronthey-axis. Italwaysremainsinpairsofnumericaldataandhelpstodeterminetherelationshipbetweenthevariables. Ifthevariablesinascatterdiagramhaveastrongcorrelation,thepointsinthegraphwillattachcloselytothe lineandfallalongalineorcurve.Adiagramwithscattereddotsmeansthereisnorelationbetweenthe variables.
Ascattereddiagramisaneffectivetoolusedbyanexperiencedmanagementconsultingfirm toanalyzethe MODELLE relationshipbetweenthedifferentproductsandconstructaplanforthefuture. Home Contact 2.ControlChart Acontrolchartisoneofthemostcommontoolsusedforqualitycontrol.It'sagraphicalrepresentationofdata, justlikethescattereddiagram. Controlchartsaremadeof3primeelements: a)TheX-axisrepresentstimeintervals,whereastheY-axisshowsthedatapointscollectedataspecifictime. b)Thehorizontallinehelpstomonitorthechangesandtoobtaintheaverageoutput. c)Itconsistsofanuppercontrollimitlineandalowercontrollimitline,whichiscalculatedusingthedata presentinthetimegraph. Themainobjectiveofthistoolistoanalyze,plan,predictandimprovethequalityofgoodsandservicesofa business. 3.Histogram Thehistogramisagraphicalrepresentationofnumericaldatausingrectangularfiguresknownasbars.TheX? axisinahistogramshowstheclassintervals,whereastheY-axisrepresentsthefrequency.Thegraphiseasyto readandrecorddatainafirm. Theprimeuseofthisgraphicaltoolistoaccumulatediscreteorcontinuousdataonanintervalscale.Itis preferredbymostbusinessesasithelpstheusertoidentifythedataeasilyandrecordcomplexdataina convenientform. For qualitymanagement,mostbusinessesusehistogramstorecordandanalyzedataontheirproductsand services. 4.CauseandEffectDiagram Thecause-and-effectdiagram,alsoknownasthefishbonediagram,wasfirstintroducedbyIshikawa.It'sa visualtoolusedtodetectthepossiblecausesofaproblem.Thediagramlooksliketheshapeofafish. Thediagramconsistsofmanybranchesorfinsofthefishwhichshowthecausesofaproblem.Thecenterline joiningthebranchesisthemainproblemthatneedstobeanalyzedandsolved.Complexbranchesshow multiplecausesofaproblem.Theheadofthefishrepresentstheeffects. Thetoolhelpsdeterminethepossiblecausesandeffectsofabusinessproblem.Byknowingthecauses,a businesscantaketherequiredmeasurestoresolvethem. 5.ParetoChart TheParetochartlookssimilartothehistogramasit'satypeofbargraph.Thechartcontainsbothabaranda linegraph.Theprimeuseofthistoolistorepresentindividualvaluesonthebargraphandcumulative frequencyinthelinegraph. StudyingaParetochart,weneedtofollowthe80/20rule.Accordingtotherule,80% oftheeffectscomefrom 20% ofthecauses. Thetoolisveryusefulinfindingoutsignificantfactorshavingthehighestimpactonidentifiedproblems.Global consulting companiesempowermanybusinessesbyusingthisqualitycontroltool. 6.Stratification Thestratificationtooliscommonlyknownasaflowchartdiagram.Aflowchartgenerallyrepresentsthe workfloworprocessofafirm.Itcontainsallthestepsafirmtakestocompleteaspecifiedtask. Theflowchartshouldbecreatedeitherfromlefttorightortoptobottom,consistingofallthestepstakenina process.Therectangularshapeboxesareusedtoshowtheprocesses,andrhombusshapeboxesareusedto showthedecisionstakeninaflowchart.
AnothercrucialuseofaflowchartordiagramistostandardizecomplexprocessesandmakeusersunderstandAnothercrucialuseofaflowchartordiagramistostandardizecomplexprocessesandmakeusersunderstand MODELLE theworkflow. Home Contact 7.Checksheet Thechecksheetqualitytoolsareusedforavarietyofpurposes.Themainfunctionofthisqualitytoolisto reducethepossibilitiesoffailure.Itensuresconsistencyandcompletenessincarryingoutatask. Generally,achecklistismadewhenyouhavealotoftasksonhand,andit'sdifficulttorememberthem.Usinga checklisthelpsyoutomanageandorganizeyourtaskinasinglesheet.Managingtasksincreasetheefficiency ofabusiness. Togrowbusinesses,it'snecessarytoidentifytheproblemsandresolvethemwitheffectivemeasures.Business managementconsultants helpalltypesoffirmsbyusingthesevenfundamentalqualitytoolsformanaging productsandservices. Alsoreadthis:- QualityistheBestBusinessPlan! Previous Next Returntosite PoweredbyStrikingly