html5-img
1 / 0

Population Geography

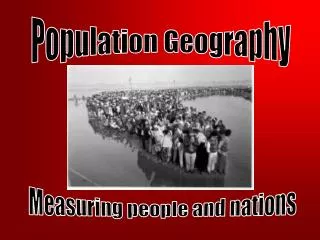
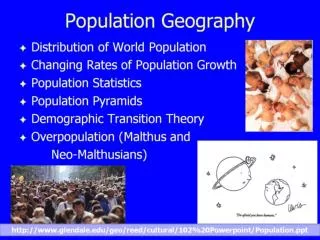
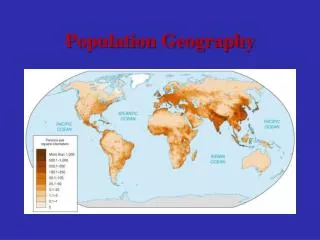
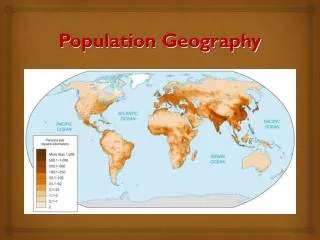
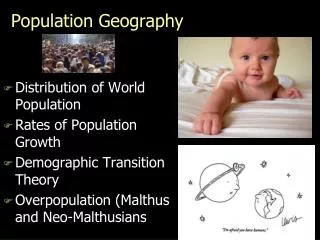
Population Geography. Counting the Worlds Population. A Lesson In Exponential Growth!. Bacteria Bottles.

eydie
Download Presentation

Population Geography

An Image/Link below is provided (as is) to download presentation Download Policy: Content on the Website is provided to you AS IS for your information and personal use and may not be sold / licensed / shared on other websites without getting consent from its author. Content is provided to you AS IS for your information and personal use only. Download presentation by click this link. While downloading, if for some reason you are not able to download a presentation, the publisher may have deleted the file from their server. During download, if you can't get a presentation, the file might be deleted by the publisher.

E N D

Presentation Transcript


  1. Population Geography

    Counting the Worlds Population
  2. A Lesson In Exponential Growth! Bacteria Bottles This puzzle illustrates the concept of exponential growth using bacteria. Bacteria multiply by division. One bacterium becomes two. Then two divide into four; the four divide into eight, and so on. For a certain strain of bacteria, the time for this division process is one minute. If you put one bacterium in a bottle at 11:00 p.m., by midnight the entire bottle will be full. John Madden - 2009/10
  3. Bacteria Bottles 1) When will the bottle be half-full? How do you know? 2) Suppose you could be a bacterium in this bottle. At what time would you first realize that you were running out of space? Why? John Madden - 2009/10
  4. Bacteria Bottles Suppose that at 11:58 some bacteria realize that they are running out of space in the bottle. So they launch a search for new bottles. They look far and wide (working at the speed of light). Finally, offshore in the Arctic Ocean, they find three new bottles! Great sighs of relief come from all the bacteria. This is three times the number of bottles they’ve ever known. Surely, they think, their space problems are over. 3) Is that so? Explain why the bacteria are still in trouble. Since their space resources have quadrupled, how long can their growth continue? (Remember it takes an hour to fill up the first bottle) John Madden - 2009/10
  5. Bacteria Bottles Ready For The Answers??? 1) The bottle will be half-full at 11:59 p.m. because the doubling time is one minute and the bottle will be full at midnight. 2) At 11:55 p.m., when the bottle was only 3% full and 97% empty, would it be easy to perceive that there was a space problem? John Madden - 2009/10
  6. Bacteria Bottles 3) With space resources quadrupled, the bacteria have two more doubling times, or two minutes before they will run out of space. 11:58 p.m. : Bottle 1 is one-quarter full. 11:59 p.m. : Bottle 1 is half-full. 12:00 a.m. : Bottle 1 is full. 12:01 a.m. : Bottles 1 and 2 are full. 12:02 a.m. : Bottles 1, 2, 3, and 4 are full John Madden - 2009/10
  7. Bacteria Bottles So, what does this suggest about Human Population Growth?? John Madden - 2009/10
  8. Bacteria Bottles John Madden - 2009/10
  9. Bacteria Bottles John Madden - 2009/10
  10. Bacteria Bottles Human Population Growth! Year John Madden - 2009/10
  11. Why study population? Over the last 12,000 years of history, population is increasing faster than ever before! In the last 2000 years, the Earth’s population has increased 10 times In the last 50 years, Earth’s population has doubled Will this population growth increase to a level that will cause a global crises?
  12. Population Basics Demography: the study of human populations Currently 7 billion people on the Earth This study is very important because the number of people in a country can influence the infrastructure and support systems of a country Population Equation Scale of inquiry: size of a geographic investigation (world, regional or local) important to understand On global scale, demographers focus on where earth’s populations are increasing fastest and where they are expanding more slowly-least stable areas experiencing the fast growth
  13. Population Facts About 81% of earth’s population lives in poorer, less developed countries The only two countries to have more than 1 billion people are India and China 1 in 3 of earth’s people live in China or India Nearly 3 of every 5 people live in Asia and Europe Largest population concentration is East Asia-nearly 25% of earth’s total population: most people subsistent farmers Third largest population cluster is Europe: most people are urban dwellers
  14. Population Distribution and Density

  15. Population Distribution Defined: pattern of people across the earth’s surface-where they live Over history, people have been unevenly distributed-Why? Few people live in desert/tundra About 75% of global population lives on 5% of worlds surface Area people can live is called the ecumene 50% of earth’s people live in cities
  16. Worlds Population Density http://en.wikipedia.org/wiki/List_of_countries_by_population_density
  17. World Areas of Population Density East Asia: China, South and North Korea and Japan 1.5 billion people with 1.3 billion in China South Asia: India, Pakistan and Bangladesh Within 50 years, India will pass China as most populace country on planet Southeast Asia: Vietnam, Indonesia and Thailand Western and Central Europe: mostly urban Northeastern United States and Canada: includes megalopolis from Boston to Washington D.C.
  18. Population Density Defined: number of people in a particular land area Arithmetic density Total number of people divided by total land area Example: Egypt has arithmetic density of 177 people per square mile but only 98% of population lives on 3% of land Physiological density Number of people per unit of arable land Helps in analyzing amount of farmland available to population U.S. physiological density is 340 people per square mile; Japan is 7,000 people per square mile; Egypt's is 3,000 people per square mile Agricultural density Number of farmers per unit of arable land High density meant many farmers are on each piece of farmland; low density suggests the presence of larger farms
  19. Population Math

  20. Adding up population numbers Equations exist to allow demographers to determine actual populations Demographic accounting equations Global population accounting equation P1=P0+B-D P1 is size of population at end of interval of measurement P0 is size of population at start of interval of measurement B is number of births during interval of measurement D is number of deaths during interval of measurement Subglobal population accounting equation P1=P0+B-D+I-E P1, P0, B and D same as above I is number of immigrants moving into region during interval of measurement E is number of emigrants moving out of region during interval of measurement Immigration: people moving into a region/country Emigration: people leaving a region/country
  21. Math Example Country A has 1 million people in 1990. Over the next 10 years 75,000 babies are born; 50,000 people die; 10,000 people move into the country; and 5,000 people exit. What would the population be in 2000? P1=1,000,000+75,000-50,000+10,000-5,000= 1,030,000 people
  22. Population Pyramids Also known as age-sex structures used to evaluate the distribution of ages and genders in a given population Shows sex ratio (number of males compared to females in a population) at ANY GIVEN TIME! Cohorts (people of the same age) are split between men and women on the pyramid Used to analyze population and/or predict future population Cannot determine country size from pyramids but can determine placement in DTM
  23. Population Pyramid Algeria’s pyramid has a wide base and a flattened top. What does that mean? Italy’s pyramid is wider in the middle than at the base. What does that mean? What expectations do you have for a population pyramid from 2025?
  24. Expanding Populations Contracting Population Stable Population
  25. 2025 Predictions Did Algeria’s growth rate decrease? How can you tell? What happened to Italy’s population? Graying population: when a population has more middle-aged and older people than young people. Why is this a problem?
  26. South Africa and the United States
  27. Fertility and Mortality Fertility: reproductive behavior of a population Impacted by Fecundity of population Diet and nutritional intake Economic and industrialization levels Sociocultural factors like age of marriage Mortality: death related behavior of a population
  28. Population Key Terms Crude Birth Rate (CBR): number of live births per 1,000 people in a year Crude Death Rate (CDR): number of deaths per 1,000 people in a year LDC’s average CDR of 20 while MDC’s average CDR of 10 Infant mortality rate (IMR): number of infant (children who die before their first birthday) deaths per 1,000 live births Life expectancy: average number of years to be lived by a person Fecundity: ability of a woman to conceive (usually 15 to 45) General fertility rate (GFR): number of births per 1,000 women in the fecund years Total fertility rate (TFR): predicted number of births a woman will have as she passes through fecund years TFR has declined on every continent but Africa over the last 50 years Example : in 1975 Mexico’s TFR was 7 but in 2009 had dropped to 2.37 – in China in 1970 TFR was 6 but 1.6 in 2009 2006 TFR rate was greater than 3.0 across the globe 2006 TFR rate in U.S., Europe and China was 2.1 or less
  29. Fertility Rates
  30. Replacement-Level Fertility A TFR of 2.1 is considered replacement-level fertility meaning parents will produce the number of children needed to replace themselves TFR of 2.1 causes zero population growth (ZPG) Rate of Natural Increase (RNI) is growth rate of a population using the formula CBR-CDR/10 Does NOT include immigration and emigration RNI that equals zero means population won’t grow or decline Global RNI in 2006 was 1.2% More developed countries had an RNI of 0.1% Less developed countries had an RNI of 1.5% Africa’s RNI in 2006 was 2.3% RNI does NOT include migration
  31. Population Graph Options: S-curves and J curves
  32. Rule of 70 Defined: time that it takes for a population to double Equation: Divide 70 by current growth rate of population 70/ current growth rate = doubling time Examples 70/5% = 14 years 70/2% = 35 years
  33. Population Consequences

    The good AND the bad!
  34. A Graying Population What would be the positives and negatives of a graying population? Dependency ratio: show relationship between dependents and nondependent's Dependents: people who depend on workers for survival Nondependent's: people who can support themselves through work High ratio means more people are dependent than working Fewer people to pay taxes Social security dependency 2000 was first time in history that people under 14 years of age were outnumbered by people over 60
  35. Carrying Capacity and Overpopulation Carrying capacity: number of people an area can sustain or support Japan: imports food Saudi Arabia: desalinizes water to increase carrying capacity Overpopulation: when a region’s population outgrows its carrying capacity Resource availability very important but resources can be indigenous or imported Some areas have resources to produce more than they harvest-lack of infrastructure, political/economic stability, etc.
  36. Other population growth consequences In China, boys now outnumber girls 119 for every 100 girls born – natural average 105 to 100
  37. Population growth theories Thomas Malthus Wrote An Essay on the Principle of Population, 1798 Argued that global population was growing exponentially while food supplies were growing arithmetically Advocated birth control and celibacy (positive checks) and warned of war, starvation and disease (negative checks) Said population growth caused poverty, crime and misery Karl Marx Said population wasn’t problem-the problem was unequal distribution of resources and wages Said population growth was caused by poverty and unequal distribution so if things were distributed evenly, population wouldn’t grow Ester Boserup Believed overpopulation problem could be solved by increasing number of subsistence farmers because when humans are faced with starvation, they WILL develop new technology Neo-Malthusians Argue that sustainable development hinges on Malthusian idea that human population must reach a “sustainable” level within carrying capacity
  38. Is population growth a problem?Two very different, but supportable ideas Yes Most of our increased food availability is tied to non-sustainable resources like oil Humans bring about environmental destruction I=PAT Environmental Impacts= Population size times affluence times technology Most humans live a lifestyle that is not sustainable No Food supplies have increased - in 1970 average caloric intake was 2,435 but in 2000 average was 2,087 Countries like China have industrialized quickly BECAUSE of increased population that create workers and a market Humans are the ultimate resource and will continue to advance to support ourselves
  39. Historical Growth

    The DTM
  40. Population Explosion Over last three centuries, earth has experienced a population explosion Currently population is growing at exponential rate Exponential growth: the more people that are added, the faster the population is growing Linear (a.k.a. arithmetic) growth: constant fixed rate of growth In 1750 world population was 700 million In 200 years (1950) population grew to 6 billion
  41. Historical population growth 10,000-12,000: first agricultural revolution Humans domesticated crops Led to development of cities and stationary settlements City development leads to population growth 1700’s Industrial Revolution and second agricultural revolution Industrial revolution was new technologies and industries-started in England Move people into cities Second industrial revolution improved fertilization and food storage increasing food supply Allowed more people in cities because extra food is grown can be sold in cities
  42. What causes population growth? Medical Advances Inoculations, better health care, new medications Quantity and quality of food Agricultural technology has increased availability and health benefit of food Ethnic and religious issues Many cultures forbid birth control or abortion Some cultures have beliefs that spread disease Economic issues Agricultural base economy=higher birth rate Industrial or service base=low or no population growth
  43. Population Projections for the Future Different growth scenarios exist Medium growth (most accepted) 2050=9 billion; 2100=9.5 billion Low-growth Population will begin declining: 2050=7.5 billion; 2100=5.1 billion High-growth scenario 2050=11 billion; 2100=16 billion
  44. Demographic Transition Model Defined: DTM predicts changes in birth, death and natural increase rates in countries as they transition or mature Based on assumption that economics drive demographic change and that all countries will pass through five stages of demographic transition or change The three measurements in the model are CBR, CDR and RNI
  45. Stage 1: Low Growth (high stationary stage) Hunter and Gatherer Societies High CBR and CDR leading to low RNI Fluctuation in CBR and CDR because of disease, famine and war Usually characterizes a subsistence farming country without industrialized economy
  46. Stage 2: High Growth (Expanding Stage) Agricultural Societies High CBR: children are still needed on the farms to help Declining CDR: CDR starts to drop as new health care systems arrive-industrialization has begun but CBR has not fallen because children still seen as economic necessity RNI increases because same high number of births is occurring with fewer deaths to match the high birth numbers Population expansion is high
  47. Stage 3: Moderate Growth (expanding stage) Industrial Societies Declining CBR CBR drops because families’ decisions to lower number of children they are having RNI is decreasing but still greater than zero so population is still expanding
  48. Stage 4: Low Growth (low stationary stage) Tertiary Societies CBR and CDR meet at equal levels (equilibrium) but this time they are at low levels RNI is low Seen as modern society stage with zero population growth
  49. Criticisms of DTM Based on England's transition from subsistent economy to industrialized society All countries may not pass through this system Some African countries received medicines and food from more developed countries England took 100 years to go from stage 2 to 3 and countries today are being pushed at a much faster rate We don’t know exactly where the 5th stage is headed. It includes a decline in the CBR as seen in modern countries like France and Germany-something that shows the graying population but what else will happen?
  50. Demographic Momentum Also known as hidden momentum Occurs in many developed countries when population continues to grow even after replacement-fertility is reached Happens when people live longer-even though TFR is 2.1 to 2.5 population is still growing because people are dying at slower rates Makes zero population growth difficult to attain
  51. Global DTM All countries on globe are out of stage 1 Most Latin American and Asian countries are in stage 3 Most African countries remain at high growth in stage 2 Many Europeans at end of stage 4 Japan, Germany and France are facing a fifth stage or the graying population problem
  52. Checks on Population

    Public and Private
  53. Negative Checks on Population Three basic categories: natural disasters, war or political turmoil and economic issues Black Plague: killed 40% of European population and 13 million Chinese in 1300s Irish potato famine: killed almost 50 percent and caused massive emigration HIV/AIDS: since 1980s has risen to pandemic (disease affecting very large amounts of people in large area) levels In 2005, 39 million people living with HIV, nearly 3 million died from AIDS In Sub-Saharan Africa, 19% of all adults are infected China expected to see nearly 11 million infections by 2010 More than ½ of 5 million new cases every year are people ages 15-24 In 2010 were 25 million AIDS orphans
  54. Global HIV/AIDS Rates
  55. Population Policies Pro-natalist policies promote reproduction and bigger families-sometimes called expansive policies Examples include tax breaks for children or antiabortion laws Found in Europe, 1950s China and modern United States Also found historically and in susbistent type economies Anti-natalist policies discourage high fertility rates-sometimes calls restrictive policies Examples include easily accessible abortions and contraceptives, or government policies limiting children Examples include India and China
  56. Global population control 1984 UN population conference held in Mexico influenced by new technologies to increase global food production and China’s recent enactment of one-child policy 1994 conference in Egypt proposed the Cairo Strategy-Teaching contraceptive uses in schools in poorer countries Cairo Strategy has been very controversial with certain conservative groups 2004 conference declared the key to limiting population growth is to empower women through education and economic parity (equality)
  57. Population Movement

    a.k.a. Migration
  58. Population Movement In the modern world, friction of distance (difficulty of distance) has been reduced Process of coming together even though distances are not decreasing is called space-time compression Spatial interaction is the interconnectedness of two places Migration: permanently moving from home region and crossing an administrative boundary
  59. Why do people migrate? Migration stream is pathway from a place of origin to a destination Many develop because of information exchange between people Usually found with migration counter stream Push factors: reasons people leave a place Examples: high taxes, high crime rates and abusive governments Pull factors: reasons people go to a new place Place desirability: possession of positive features making people want to move there Examples: affordable real estate, being near family member, good schools
  60. Voluntary Migration Occurs when migrants have an option of whether or not to move Usually not associated with violence or abusive governments Example: a new job, moving to be near family Forced Migration Emigrants pushed from land Refugees: migrants fleeing some form of persecution or abuse International refugees: fell country to move to another country Intranational refugees: abandon homes but remain in their country to escape persecution Sometimes called internally displaced peoples Voluntary vs. Forced Migration
  61. Brief history of migration About 3% of worlds people have migrated from their countries of origin North America, Oceania and Europe have net immigration Asia, Africa and Latin America have net emigration 50% of Southwest Asia’s population are immigrants U.S. had three major waves of immigration Colonial era (1607-1776) primarily from Europe and Africa and was both voluntary and involuntary 19th century primarily from Europe Before 1840 England, 1840-1850’s German and Irish 20th century 1907 northern and western Europe and Russia; 1970-1980’s Asia leading source of immigrants, 1980’s Latin America primary source Immigration altered by Quota Act of 1921 which allowed highest number of immigrants from European countries and discriminated against Asians and other regions
  62. 8 Great Migrations (KNOW THESE!)
  63. Internal Migration Defined: movement within a country Interregional migration Moving from region in the country to another region Intraregional migration Moving within a region, such as from a city to a suburb Urban migration Migration from farms to cities
  64. Migration Selectivity Often, migration fits into a pattern based on age, income and other socioeconomic factors Defined: evaluation of how likely someone is to migrate based on personal, social and economic factors Most influential factor is age Most people move 12 times in their lifetimes, ½ before age 25 Brain Drain: net out-migration from one place of most educated workers who leave for more attractive places Guest Workers: people let into a country to work jobs native people don’t necessarily want to do like heavy, dangerous or disagreeable work
  65. Ravenstein’s Migration “Laws” Late 1800s, British geographer Ernst Ravenstien identified 11 generalizations about migration-some still apply today The majority of migrants travel short distances Step migration: person has a long distance goal in mind and achieves it in a series of small steps Intervening opportunity: when an opportunity is found along destination that journey is stopped Intervening obstacles: barriers in migration journey like financial problems, roadblocks, immigration requirements and wars
  66. Ravenstein’s “Laws”, cont. Migrants who are traveling a long way tend to move to larger cities than smaller cities Large city has more opportunities creating an almost magnetic pull Keep in mind, Ravenstein was writing during height of industrial revolution Rural residents are more likely to migrate than are urban residents True in Ravenstein’s time because of industrial revolution Seen in many developing countries like China and Brazil
  67. Last two “Laws” Families are less likely to migrate across national borders than are young adults It is easier for single people to migrate than whole families Singe people less encumbered with responsibilities Every migration stream creates a counter stream Net migration is the number of people in the original flow minus the number of people in opposite flow (counter stream) Caused by many factors Example: Jews leaving Germany before WWII who were captured at borders and forced to return or young boy from rural setting who moves to city and then returns to rural area after trying city life
  68. Chain Migration Occurs when people migrate to be with other people who migrated before them and with whom they feel some tie Tie can be religious, familial, cultural, ethnic or any type of connection Most common type of migration to the U.S.
More Related