Download
1 / 30
300 likes | 411 Views
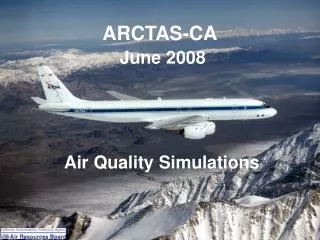
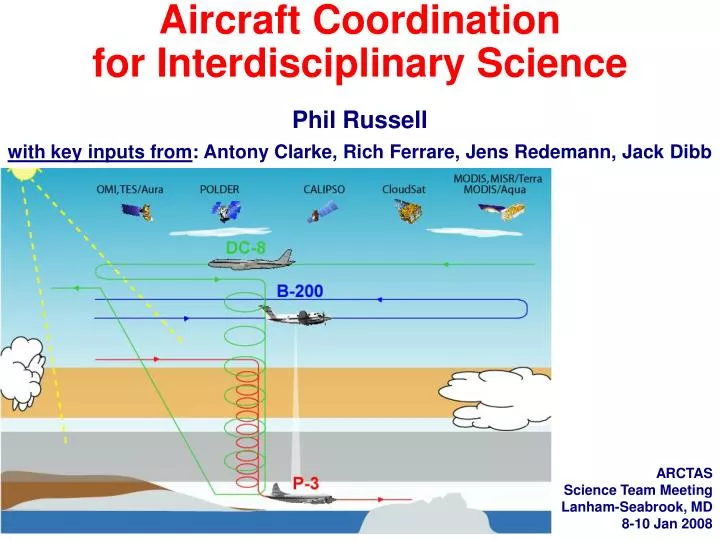
Aircraft Coordination for Interdisciplinary Science Phil Russell with key inputs from : Antony Clarke, Rich Ferrare, Jens Redemann, Jack Dibb. ARCTAS Science Team Meeting Lanham-Seabrook, MD 8-10 Jan 2008. Motivations for Coordinated Flight Plans.

E N D
Aircraft Coordination for Interdisciplinary SciencePhil Russellwith key inputs from: Antony Clarke, Rich Ferrare, Jens Redemann, Jack Dibb ARCTAS Science Team Meeting Lanham-Seabrook, MD 8-10 Jan 2008
Motivations for Coordinated Flight Plans • Questions that ARCTAS and POLARCAT address involve measurements that are on different A/C. • Some objectives require concurrent measurements with diverse platforms. • Similar measurements on different platforms need intercomparisons to confirm a common data set. • Scientific return and a broader spatial and temporal context are enhanced through coordinating A/C with satellite overpasses and/or surface sites.
Example Science Question How does Arctic aerosol radiative forcing efficiencyrelate to aerosol particle size distribution, composition (including water content, ionic, organic), & mixing state (internal, external)?
Science Questions • How do Arctic aerosol, cloud, and surface properties important to radiation and remote sensing relate to aerosol physiochemical properties and history? • Properties important to radiation and remote sensing • Aerosol radiative forcing efficiency • Cloud albedo, optical depth and droplet size • Surface reflectance and albedo • Aerosol extinction-to-backscatter ratio • Aerosol SSA(l) & absorption Angstrom exponent • Related aerosol physiochemical properties and history • - particle size distribution • composition (including water content, ionic, organic) • mixing state (internal, external) • sizes active as cloud condensation nuclei (CCN) • particle shape • Gas-phase tracers, precursors & trajectories (sources)
Science Question(s) • How do Arctic aerosol, cloud and surface properties important to radiation and remote sensing relate to aerosol physiochemical properties and history? • Examples of properties important to radiation and remote sensing • Aerosol radiative forcing efficiency [P-3] • Cloud albedo, optical depth and droplet size [P-3] • Surface reflectance and albedo [P-3] • Aerosol extinction-to-backscatter ratio [B-200] • Aerosol SSA(l) & absorption Angstrom exponent [P-3] • Examples of aerosol physiochemical properties and history • - Aerosol particle size distribution [P-3, DC-8, B-200] • Aerosol composition (including water content) [P-3, DC-8] • Aerosol particle shape [B-200, others?] • Gas-phase tracers, precursors & trajectories (sources) [DC-8]
From the ARCTAS White Paper: Strategy for enabling exploitation of NASA satellite data to improve understanding of arctic atmospheric composition and climate ** ** ** **+ clouds & radiation
B-200 B-200 P-3 P-3 Now it’s time to get more specific!
40 km Lidar image in April 1986: Vertical Structure of Arctic Haze Chuck Brock, NOAA ESRL NASA-GISS 2007 • Extremely laminar transport • Sloping thin layers • Strong gradients vertically & horizontally • Frequently decoupled surface layer • (relevance of surface statistics?) • Highest concentrations may be aloft • Diamond dust and stratus near surface Treffeisen et al. SAGE II observations suggest maximum vertical extent in March-April.
The following examples are in terms of Flight Modules Because: • The P-3 & DC-8 have long flight durations • Coordinated flight patterns will only be part of any given flight • It’s usually easier to coordinate early in a flight than later
Clear sky, Module 1 CALIPSO B-200 P-3
Coordinated B200/HSRL - Airborne in situ Measurements Ex. DOE CHAPS – June 2007 • Increases in total aerosol number measured by PCASP instrument on G-1 suggests penetration of plume from Oklahoma City • However, coincident HSRL aerosol backscatter measurements show these aerosol number variations are due to G-1 flying in and out of PBL rather than Oklahoma City plume June 23, 2007 DOE CHAPS Mission G-1 In situ Measurements G-1 Flight Altitude Slide courtesy of Carl Berkowitz (PNNL)
Clear sky, Module 2 • Compare DC-8 & B-200 lidar profiles • (+ CALIPSO if available) • (2) Nested spirals give comparisons of DC-8 in situ to • - P-3 in situ • - AATS & HSRL ext
Background on Radiative Flux Divergence & Closure, Absorption Spectra, etc. 2000 m Downwelling Flux: F Upwelling Flux: F Net Flux: F- F Flux Divergence (absorption): (F- F)2000m- (F- F)43m Fractional absorption: [(F- F)2000m- (F- F)43m]/ F2000m 43 m P. Russell, Earth Science Seminar, NASA Ames, 19 July 2007
Pilewskie, Bergstrom, Schmid et al. P. Russell, Earth Science Seminar, NASA Ames, 19 July 2007
Aerosol Single Scattering Albedo Spectrum Derived from measured flux and AOD spectra. Desirable features: Describes aerosol in its ambient state (incl volatiles like water, organics, nitrates) Wide l range: UV-Vis-SWIR Includes l range of OMI-UV, OMI-MW, MISR, MODIS, CALIPSO, HSRL, Glory ASP, RSP, POLDER, … Coalbedo (1-SSA) varies by factor 4, l = 350-900 nm Single scattering albedo 12 April 2001, ACE-Asia [Bergstrom, Pilewskie, Schmid et al., JGR 2004] Wavelength, nm P. Russell, Earth Science Seminar, NASA Ames, 19 July 2007
SSA Spectra from 4 Experiments Single Scattering Albedo Wavelength, nm Bergstrom et al., ACP, 2007 P. Russell, Earth Science Seminar, NASA Ames, 19 July 2007
Aerosol Absorption Optical Depth (AAOD) Spectra from 5 Experiments AAE = 1.45 AAOD = K l-AAE 2.27 Absorption Optical Depth 1.05 Absorption Angstrom Exponent (AAE) 2.34 1.12 For Black Carbon, AAE = 1 Wavelength, nm Bergstrom et al., ACP, 2007 P. Russell, Earth Science Seminar, NASA Ames, 19 July 2007
Aerosol Optics Wavelength dependence of absorption over Mexico is linked to both the organic carbon component (AMS - J, Jimenez, P. DeCarlo) and dust. Model and remote sensing implications for SSA etc. Pollution { Shortwave Enhancement due to dust Trend due to OC mass fraction Expected value for pure BC Dust Shinozuka, Clarke et al., 2007 P. Russell, Earth Science Seminar, NASA Ames, 19 July 2007
Radiative Flux Closure with In Situ • Compare NASA & NOAA P-3 SSFRs & BBRs, NASA P-3 & DC-8 in situ • (2) Flux divergence by 2 P-3s while DC-8 samples within layer & B-200 profiles from above. • (3) P-3 spiral in HSRL curtain gives 4-way extinction comparison (HSRL, AATS, HiGEAR, AERO3X) • (4) Flux divergence with 2 P-3s in swapped positions Caveat: Only Summer smoke may have large enough AOD
Partly cloudy, Module 1 Add DC-8 for below-cloud aerosol & within-cloud measurements
Partly cloudy, Module 1 Add CV-580 for below-cloud aerosol & within-cloud measurements
Cloudy, Module 1 Add DC-8 for below-cloud aerosol & within-cloud measurements
Cloudy, Module 1 Add CV-580 for below-cloud aerosol & within-cloud measurements
End of Presentation Remaining slides are backup P. Russell, Earth Science Seminar, NASA Ames, 19 July 2007
Coordinated B200/HSRL - Airborne in situ Measurements Ex. INTEX-B/MILAGRO/MAX-Mex – March 2006 • HSRL data provide vertical context for in situ data • HSRL and G-1 measurements show changes associated with Mexico City pollution • West side of MC basin • High depolarization, low aerosol/extinction ratio: dust • East side of MC basin • Low depolarization, high extinction/backscatter ratio: urban pollution Extinction; AOT (532 nm) Depolarization (532 nm) G-1 Flight Altitude Extinction/Backscatter Ratio (532 nm) Backscatter l Dependence (1064/532 nm)