Download
1 / 5
50 likes | 73 Views
Unlimited opportunities are waiting ahead, in fact are just a click away. Excelr is catering best Data Science Certification in Pune and making the future even brighter of many. Learn with experts with full time support and Lifetime access to all the classes even if u have missed any we provide live session. Faculty from, Alumni of IIT, IIM, ISB, PhD qualified with placement assistance.<br>https://www.excelr.com/data-science-course-training-in-pune/<br>

E N D
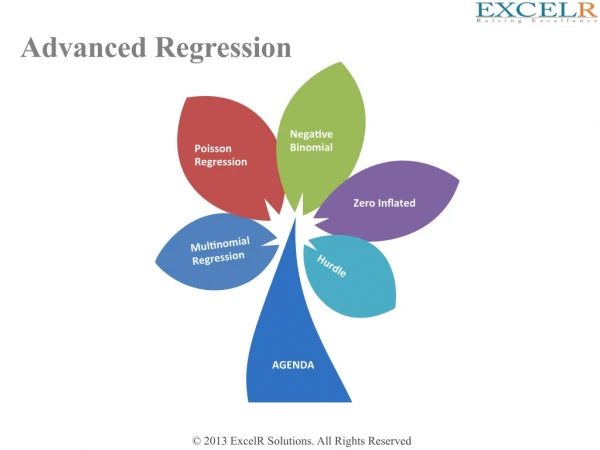
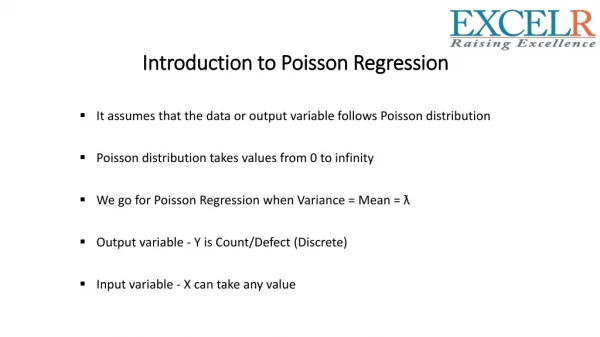
Introduction to Poisson Regression It assumes that the data or output variable follows Poisson distribution Poisson distribution takes values from 0 to infinity We go for Poisson Regression when Variance = Mean = ƛ Output variable - Y is Count/Defect (Discrete) Input variable - X can take any value
Examples of Poisson Regression Example 1. The number of persons killed by mule or horse kicks in the Prussian army per year. Ladislaus Bortkiewicz collected data from 20 volumes of Preussischen Statistik. These data were collected on 10 corps of the Prussian army in the late 1800s over the course of 20 years. Example 2. The number of people in line in front of you at the grocery store. Predictors may include the number of items currently offered at a special discounted price and whether a special event (e.g., a holiday, a big sporting event) is three or fewer days away. Example 3. The number of awards earned by students at one high school. Predictors of the number of awards earned include the type of program in which the student was enrolled (e.g., vocational, general or academic) and the score on their final exam in math.
Description of the data In this example, num_awards is the outcome variable and indicates the number of awards earned by students at a high school in a year, math is a continuous predictor variable and represents students’ scores on their math final exam, and prog is a categorical predictor variable with three levels indicating the type of program in which the students were enrolled. It is coded as 1 = “General”, 2 = “Academic” and 3 = “Vocational”.