Download

1 / 31
310 likes | 323 Views
This report contains the average monthly and annual voluntary employee turnover rates across major U.S. industries over the past 10 years. And, compare your organizationu2019s turnover rate with its industry average. See if your employees quit at a higher, similar, or lower rate than your competitors.<br><br>Checkout ExitPro's exit interview software. ExitPro exit interview forms are available in 18 languages and 56 countries with customizable report templates. Live Voice, SMS Text, & Kiosk services included. Go to website https://exitpro.com/

E N D
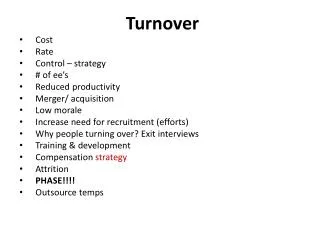
EMPLOYEE TURNOVER TRENDS 10-Year Industry Tracking Report: 2022 Edition Region: United States Data Range: 2012 - 2021 www.exitpro.com | 212.545.1280 ExitPro: Exit Interview Software
Introduction www.exitpro.com | 212.545.1280
Introduction This report contains the average monthly and annual Voluntary employee employee turnover major U.S. industries over the past 10 years. turnover rates rates across Want a Turnover Cost Calculator?…Click: CALCULATE THE COST OF EMPLOYEE TURNOVER HERE Compare your organization’s turnover rate with its industry average. See if your employees quit at a higher, similar, or lower rate than your competitors. The heat maps herein indicate the monthly turnover rate during the 10-year period from 2012 to 2021 Darker red indicates a high turnover rate compared to same month same month in past 10 years Darker green indicates a low turnover rate compared to same month same month in past 10 years Data extracted from United States Bureau of Labor Statistics (Employment & Unemployment Release), November 2021 www.exitpro.com | 212.545.1280 ExitPro: Exit Interview Software
Employee Turnover Rate Definition EMPLOYEE TURNOVER Number of Employees Separated X 100 = Average # of Active employees during Time Period* RATE Aggregate turnover ≠ Actual Turnover • Not all turnover is created equal • Aggregate turnover rate alone can be misleading • Target key employee populations to pinpoint opportunities & areas of focus and for accurate reference for impact • Examples: Engineers in London…Millennial Sales Associates… Women Directors and above…3+ Year Tenured Accountants Distinguish different “Types” of Turnover: • Voluntary • Involuntary • Retirees • Transfers • Interns • Contract Positons Remember: Precision produces prediction Remember: Precision produces prediction (Are you asking each Type the right questions when they leave?) *Time Period = Use Daily Average or (Active # on 1stday of period + # on Last day of period) / 2 www.exitpro.com | 212.545.1280 ExitPro: Exit Interview Software
Executive Summary www.exitpro.com | 212.545.1280
Executive Summary: 2022 Forecast In the near future, Voluntary Employee Turnover is likely to: • Remain at elevated levels Turnover will not immediately be affected by: • Self-Driving Cars (in Trucking/Transportation) • Vaccine Mandates • This is due to: • Record low unemployment in most industries • High availability of financial capital • Above average GDP growth • Accelerating Salary Inflation • Shrinking labor pool • Turnover will be affected long-termby: • Expanding virtualization/remote work • Accelerating robotics deployment (in Manufacturing, Mining, and Warehousing) • Renewal energy industry growth National turnover rates will change if: (Other than significant economic event or natural disaster) • Immigration quotas increase substantially (= Turnover) • Consumer spending decreases significantly (= Turnover) • Infrastructure legislation fails to pass (= Turnover) • • DISCLAIMER: Assertions above are based on proprietary analysis and publicly available information at the time. Retensa considers multiple varied economic indicators, consumer trends, and technological advancements to form these opinions, however makes no warranty on the information provided, and no guarantee is expressed or implied. www.exitpro.com | 212.545.1280 ExitPro: Exit Interview Software
How Does Forecast Impact Our Recruiting Strategy? 1. 1. High Turnover High Turnover = 2. 2. High Job Demand High Job Demand = Salary inflation, benefits war, rejected offers 3. 3. Low Talent Supply Low Talent Supply = Longer Time-to-Fill, lower Quality of Hire 4. 4. Unable to Fill Vacant Positions Unable to Fill Vacant Positions = Higher Stress and workload on existing staff 5. 5. Poor Work Poor Work- -Life Balance Life Balance = Work-Life “Blur”, more mistakes, burnout, higher turnover Higher job fills and overhead costs www.exitpro.com | 212.545.1280 ExitPro: Exit Interview Software
Reference www.exitpro.com | 212.545.1280
What is ExitPro? ExitPro is the leading provider of Secure Secure Exit Interview Software Exit Interview Software ExitPro, created from the most successful exit interview survey questions, automates and streamlines exit interview templates for 50 to 50,000 employees. ExitPro’s exit interview forms are available in 18 languages in 56 countries, with customizable customizable Exit Exit Reports Reports and Advanced Advanced Dashboard turnover. Additional Live Voice (phone), SMS Text, & Kiosk services are available. Dashboard analytics analytics to predict staff www.exitpro.com | 212.545.1280 ExitPro: Exit Interview Software
Who is Retensa? Internationally-recognized employee retention experts by: • www.exitpro.com | 212.545.1280 ExitPro: Exit Interview Software
Who is Retensa? Organizations in 56 countries and 18 languages choose Retensa for: Cloud Software Technology Cloud Software Technology • ExitPro ExitPro® ® Exit Interview Management • HRMetricsPro HRMetricsPro™ ™Talent Analytics Suite • TalentPulse® TalentPulse® Unified Survey Platform • Candidate, New Hire, Engagement, Stay Interview, Diversity Surveys, 30- 60-90 Surveys, etc. • 360 Degree Assessments, Upwards Evaluations, Performance Checks • Employee Pulse Feedback Services Services • Cost of Turnover Analysis • Exit Interview Outsourcing • Merger & Acquisition Tracking • Retention Skills Training • Talent Analytics Program Design • Turnover Diagnostic www.exitpro.com | 212.545.1280 ExitPro: Exit Interview Software
Where does ExitPro manage Exit Interviews? www.exitpro.com | 212.545.1280 ExitPro: Exit Interview Software
A History of Cutting Edge Research: Retention Thought-Leadership 2020 2019 2001 2006 2008 2009 2010 2011 2012 2013 2014 2015 2018 www.exitpro.com | 212.545.1280 ExitPro: Exit Interview Software
Turnover Rates www.exitpro.com | 212.545.1280
Table of Contents (Index) Industries covered include the following (quicklinks 1. 1. Arts & Entertainment Arts & Entertainment 2. 2. Construction Construction 3. 3. Education Education 4. 4. Finance & Insurance Finance & Insurance 5. 5. Government Government 6. 6. Healthcare Healthcare 7. 7. Hotels & Restaurants Hotels & Restaurants 8. 8. Manufacturing Durable Goods Manufacturing Durable Goods 9. 9. Manufacturing Non Manufacturing Non- -Durable Goods Durable Goods 10. 10. Mining & Logging Mining & Logging 11. 11. Professional Services Professional Services 12. 12. Real Estate Real Estate 13. 13. Retail Retail 14. 14. Transportation Transportation quicklinksbelow will access your industry below will access your industry): ExitPro: Exit Interview Software 15 www.retensa.com | 212.545.1280 www.exitpro.com | 212.545.1280
Industry Turnover Rate (%): Arts & Entertainment (USA) Arts & Entertainment (USA) To view the full ExitPro Employee Turnover Trends Report Visit Store.ExitPro The heat map table indicates average monthly and cumulative annual turnover rates Darker red indicates a high turnover rate compared to same month in past 10 years Darker green indicates a low turnover rate compared to same month in past 10 years ExitPro: Exit Interview Software 16 www.retensa.com | 212.545.1280 www.exitpro.com | 212.545.1280
Industry Turnover Rate (%): Construction (USA) Construction (USA) To view the full ExitPro Employee Turnover Trends Report Visit Store.ExitPro The heat map table indicates average monthly and cumulative annual turnover rates Darker red indicates a high turnover rate compared to same month in past 10 years Darker green indicates a low turnover rate compared to same month in past 10 years ExitPro: Exit Interview Software 17 www.retensa.com | 212.545.1280 www.exitpro.com | 212.545.1280
Industry Turnover Rate (%): Education (USA) Education (USA) To view the full ExitPro Employee Turnover Trends Report Visit Store.ExitPro The heat map table indicates average monthly and cumulative annual turnover rates Darker red indicates a high turnover rate compared to same month in past 10 years Darker green indicates a low turnover rate compared to same month in past 10 years ExitPro: Exit Interview Software 18 www.retensa.com | 212.545.1280 www.exitpro.com | 212.545.1280
Industry Turnover Rate (%): Finance & Insurance (USA) Finance & Insurance (USA) To view the full ExitPro Employee Turnover Trends Report Visit Store.ExitPro The heat map table indicates average monthly and cumulative annual turnover rates Darker red indicates a high turnover rate compared to same month in past 10 years Darker green indicates a low turnover rate compared to same month in past 10 years ExitPro: Exit Interview Software 19 www.retensa.com | 212.545.1280 www.exitpro.com | 212.545.1280
Industry Turnover Rate (%): Government (USA) Government (USA) To view the full ExitPro Employee Turnover Trends Report Visit Store.ExitPro The heat map table indicates average monthly and cumulative annual turnover rates Darker red indicates a high turnover rate compared to same month in past 10 years Darker green indicates a low turnover rate compared to same month in past 10 years ExitPro: Exit Interview Software 20 www.retensa.com | 212.545.1280 www.exitpro.com | 212.545.1280
Industry Turnover Rate (%): Healthcare (USA) Healthcare (USA) To view the full ExitPro Employee Turnover Trends Report Visit Store.ExitPro The heat map table indicates average monthly and cumulative annual turnover rates Darker red indicates a high turnover rate compared to same month in past 10 years Darker green indicates a low turnover rate compared to same month in past 10 years ExitPro: Exit Interview Software 21 www.retensa.com | 212.545.1280 www.exitpro.com | 212.545.1280
Industry Turnover Rate (%): Hotels & Restaurants (USA) Hotels & Restaurants (USA) To view the full ExitPro Employee Turnover Trends Report Visit Store.ExitPro The heat map table indicates average monthly and cumulative annual turnover rates Darker red indicates a high turnover rate compared to same month in past 10 years Darker green indicates a low turnover rate compared to same month in past 10 years ExitPro: Exit Interview Software 22 www.retensa.com | 212.545.1280 www.exitpro.com | 212.545.1280
Industry Turnover Rate (%): Manufacturing Durable Goods (USA) Manufacturing Durable Goods (USA) To view the full ExitPro Employee Turnover Trends Report Visit Store.ExitPro The heat map table indicates average monthly and cumulative annual turnover rates Darker red indicates a high turnover rate compared to same month in past 10 years Darker green indicates a low turnover rate compared to same month in past 10 years ExitPro: Exit Interview Software 23 www.retensa.com | 212.545.1280 www.exitpro.com | 212.545.1280
Industry Turnover Rate (%): Manufacturing Non Manufacturing Non- -Durable Goods (USA) Durable Goods (USA) To view the full ExitPro Employee Turnover Trends Report Visit Store.ExitPro The heat map table indicates average monthly and cumulative annual turnover rates Darker red indicates a high turnover rate compared to same month in past 10 years Darker green indicates a low turnover rate compared to same month in past 10 years ExitPro: Exit Interview Software 24 www.retensa.com | 212.545.1280 www.exitpro.com | 212.545.1280
Industry Turnover Rate (%): Manufacturing Total (USA) Manufacturing Total (USA) To view the full ExitPro Employee Turnover Trends Report Visit Store.ExitPro The heat map table indicates average monthly and cumulative annual turnover rates Darker red indicates a high turnover rate compared to same month in past 10 years Darker green indicates a low turnover rate compared to same month in past 10 years ExitPro: Exit Interview Software 25 www.retensa.com | 212.545.1280 www.exitpro.com | 212.545.1280
Industry Turnover Rate (%): Mining & Logging (USA) Mining & Logging (USA) To view the full ExitPro Employee Turnover Trends Report Visit Store.ExitPro The heat map table indicates average monthly and cumulative annual turnover rates Darker red indicates a high turnover rate compared to same month in past 10 years Darker green indicates a low turnover rate compared to same month in past 10 years ExitPro: Exit Interview Software 26 www.retensa.com | 212.545.1280 www.exitpro.com | 212.545.1280
Industry Turnover Rate (%): Professional Services (USA) Professional Services (USA) To view the full ExitPro Employee Turnover Trends Report Visit Store.ExitPro The heat map table indicates average monthly and cumulative annual turnover rates Darker red indicates a high turnover rate compared to same month in past 10 years Darker green indicates a low turnover rate compared to same month in past 10 years ExitPro: Exit Interview Software 27 www.retensa.com | 212.545.1280 www.exitpro.com | 212.545.1280
Industry Turnover Rate (%): Real Estate (USA) Real Estate (USA) To view the full ExitPro Employee Turnover Trends Report Visit Store.ExitPro The heat map table indicates average monthly and cumulative annual turnover rates Darker red indicates a high turnover rate compared to same month in past 10 years Darker green indicates a low turnover rate compared to same month in past 10 years ExitPro: Exit Interview Software 28 www.retensa.com | 212.545.1280 www.exitpro.com | 212.545.1280
Industry Turnover Rate (%): Retail (USA) Retail (USA) To view the full ExitPro Employee Turnover Trends Report Visit Store.ExitPro The heat map table indicates average monthly and cumulative annual turnover rates Darker red indicates a high turnover rate compared to same month in past 10 years Darker green indicates a low turnover rate compared to same month in past 10 years ExitPro: Exit Interview Software 29 www.retensa.com | 212.545.1280 www.exitpro.com | 212.545.1280
Industry Turnover Rate (%): Transportation (USA) Transportation (USA) To view the full ExitPro Employee Turnover Trends Report Visit Store.ExitPro The heat map table indicates average monthly and cumulative annual turnover rates Darker red indicates a high turnover rate compared to same month in past 10 years Darker green indicates a low turnover rate compared to same month in past 10 years ExitPro: Exit Interview Software 30 www.retensa.com | 212.545.1280 www.exitpro.com | 212.545.1280
Discover the next generation of Talent Management solutions: THANK YOU THANK YOU Exit Interview + Separation Management Exit Interview + Separation Management www.exitpro.com Employee Experience + Talent Analytics Employee Experience + Talent Analytics www.talentpulse.com Retention Strategies + Retention Training Retention Strategies + Retention Training www.retensa.com ExitPro: Exit Interview Software 31 www.retensa.com | 212.545.1280 www.exitpro.com | 212.545.1280