Structural Analysis in Large Networks Observations and Applications
960 likes | 1.14k Views
Structural Analysis in Large Networks Observations and Applications. Mary McGlohon Committee Christos Faloutsos, co-chair Alan Montgomery, co-chair Geoffrey Gordon David Jensen, University of Massachusetts, Amherst. Motivation.

Structural Analysis in Large Networks Observations and Applications
E N D
Presentation Transcript
Structural Analysis in Large NetworksObservations and Applications Mary McGlohon Committee Christos Faloutsos, co-chair Alan Montgomery, co-chair Geoffrey Gordon David Jensen, University of Massachusetts, Amherst
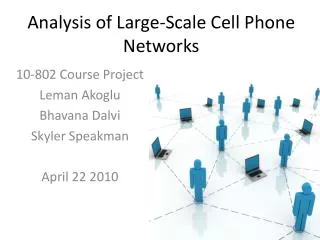
Motivation • Network (a.k.a. graph, relational, social network) data has become ubiquitous. We want to know: • How do networks form and structure themselves? • How does information propagate through networks? • How do sub-communities form? 1 2 3 Computer networks IMDB actor-movie Facebook
“Outline” for thesis 1 2 3
Motivation: Topology • How do these network strucures form? • Example: identify topological properties common to many different types of graphs (citations, friendships, etc.) • Developing models of these properties allows for forecasting. 1 vs
Motivation: Cascades • Once the networks form, how does information propagate through the graph? • Example: Extract, analyze, and model cascades. 2 Cascade Graph topology
Motivation: Community • How do we compare communities, or sub-networks? • Example: For a set of online groups (Usenet), which ones continue to thrive over time? 3 2004 2008?
Thesis statement • We propose to • investigate how interactions in graphs occur, how these interactions lead to diffusion and community behavior, and • to model these behaviors and apply these findings to real-world problems. 1 2 3
We propose to… investigate how interactions in graphs occur, how these interactions lead to diffusion and community behavior, and to model these behaviors and apply these findings to real-world problems.
Impact • Understanding the relations found in networks has many applications, such as: • Fraud/anomaly detection • Given typical behavior and information about nodes/edges, how “suspicious” is a node or group of nodes? • Ad personalization/recommendation systems • Given some information about an individual and their friends, which ads to display? • Resource allocation • Given typical patterns of network growth, how can we allocate resources (hardware, advertising budget, etc.)?
Completed Work KDD08 ICDM08 ICWSM07 ICWSM09-2* ICWSM09-3* KDD09* ICWSM09-1* SDM07 *- to appear
Proposed Work P1a: How do cascades compare across network structures? P1b: Can we use cascades to model product adoption? P2: Can we predict success/failure of groups?
The rest of the talk • Motivation and thesis statement • Completed work • Proposed work • Conclusions and impact • Audience participation!
Completed Work What patterns are common to networks?
Topological Observations • Diameter over time • Connected components (Kevin Bacon) • Edge weights
Topological Observations: Data • Analyze unipartite and bipartite networks • Networks are evolving over time • Networks may be weighted • -Repeated edges • -Edge weights 10 3 n1 3 10 1.2 Unipartite Citations, Blogs, Router traffic n1 Bipartite IMDB Actor-Movie, Campaign contributions… n3 m1 n2 1 1.2 n2 8.3 1 m2 n4 6 8.3 n3 6 m3 n5 2 n4 n6 2 n7
Topological Observations: Gelling Point • When does a graph begin displaying expected patterns, such as the giant connected component? How can we tell when this happens?
Topological Observations: Gelling Point • Observation: Most real graphs display a gelling point, where the graph begins to come together and the giant connected component forms. After that point, they exhibit typical behavior. IMDB t=1914 Diameter Time
Topological Observations: NLCCs • In graphs a giant connected component emerges. • We look at sizes of the next-largest connected components (NLCCs) • After gelling point, do they continue to grow? Do they shrink?
Topological Observations: NLCCs • Observation: After the gelling point, the giant connected component takes off, but next-largest connected components remain constant or oscillate. IMDB t=1914) ia 2nd connected component Size of next-largest connected components 3rd connected component Time
Topological Observations: Weights • How are edges in a graph repeated, or otherwise weighted? • As the number of edges increases, does the total edge weight grow linearly?
Topological Observations: Weights • Observation: Weight additions follow a power law with respect to the number of edges: W(t) ∝E(t)w • W(t): total weight of graph at t • E(t): total edges of graph at t • w is PL exponent (w>1) • Many other weighted laws: see [KDD08, ICDM08] Orgs-Candidates log(Weights) slope=1.3 log(Edges)
Completed Work What patterns are common to networks?
Completed Work Gelling point, CC’s Weighted laws
Completed Work Can we develop generative models? Gelling point, CC’s Weighted laws
Topological Models: “Butterfly” • Goals are to generate: • Constant/oscillating NLCC’s • Densification power law [Leskovec+05] • Shrinking diameter (after “gelling point”) • Power-law degree distribution • Emergent, local, intuitive behavior
Topological Models: “Butterfly” • Main idea: Uses 3 parameters • “Curiosity”: how much to explore local network (~U(0,1), creates power-law degree distribution) • “Flyout”: how many local networks to explore (global, joins components) • “Friendliness”: how often to connect (global, allows new components) • Details: see [KDD08]
Topological Models: “Butterfly” Shrinking diameter • Densification Diam- eter log(edges) slope=1.17 Nodes log(nodes) • Power-law degree distribution • Oscillating NLCCs NLCC size slope=-2 Log(count) Nodes Log(degree)
Completed Work Can we develop generative models? Gelling point, CC’s Weighted laws
Completed Work Butterfly RTM Oddball Gelling point, CC’s Weighted laws
Completed Work Gelling point, CC’s Weighted laws What are patterns of cascades in networks? Butterfly RTM Oddball
Cascade Observations: Data • Gathered from August-September 2005* • Used set of 44,362 blogs, traced cascades • 2.4 million posts • 245,404 blog-to-blog links Sep 29 Aug 1 Number of posts Jul 4 Time [1 day]
Cascade Observations: Prelims B1 • How quickly does a link to a post occur? • What size do cascades typically reach? • What are typical shapes– how often are “stars” and “chains” occurring? B2 a b c d B3 B4 e Blogosphere “Star” “Chain” a c b d e e Cascades
Temporal Observations • How quickly does a link to a post occur? • Does popularity decay at a constant rate? • With an exponential (“half life”)? Linear-linear scale Log-linear scale Log-log scale
Cascade Observations: Link Popularity • Observation: The probability that a post written at time tp acquires a link at time tp + Δ is: p(tp+Δ) ∝Δ-1.5 • Similar to [Vazquez+06] slope=-1.5 log( # in-links) log(days after post) (Linear-linear scale)
Cascade Observations: Cascade Size • Q: What size distribution do cascades follow? Are large cascades frequent? • Observation: The probability of observing a cascade of n blog posts follows a Zipf distribution: p(n) ∝ n-2 log(Count) slope=-2 a c b d e e log(Cascade size) (# of nodes)
Cascade Observations: Cascade Size • Q: What is the distribution of particular cascade shapes? • Observation: Stars and chains in blog cascades also follow a power law, with different exponents (star -3.1, chain -8.5). log(Count) a=-8.5 a=-3.1 log(Count) log(Size) of star (# nodes) log(Size) of chain (# nodes)
Completed Work Gelling point, CC’s Weighted laws What are patterns of cascades in networks? Butterfly RTM Oddball
Completed Work Gelling point, CC’s Weighted laws Cascades laws Cascades as features Butterfly RTM Oddball
Completed Work Gelling point, CC’s Weighted laws Cascades laws Cascades as features Can we develop predictive models for cascades? Butterfly RTM Oddball
Cascade Models: CGM • Cascade Generation Model • Overview: Produce realistic cascades through an emergent “viral” model • Details: See [SDM07]
Cascade Models: CGM Data Model Most frequent cascades log(Count) model log(Cascade size) (# nodes) data log(Count) log(Count) log(Star size) log(Chain size)
Completed Work Gelling point, CC’s Weighted laws Cascades laws Cascades as features Can we develop predictive models for cascades? Butterfly RTM Oddball
Completed Work Gelling point, CC’s Weighted laws Cascades laws Cascades as features Cascade generation model ZC model Butterfly RTM Oddball
Completed Work Gelling point, CC’s Weighted laws Cascades laws Cascades as features How can we compare communities? Cascade generation model ZC model Butterfly RTM Oddball
Completed Work Gelling point, CC’s Weighted laws Cascades laws Cascades as features Political Usenet study Cascade generation model ZC model Butterfly RTM Oddball
Completed Work Gelling point, CC’s Weighted laws Cascades laws Cascades as features Political Usenet study Can we detect anomalies? Cascade generation model ZC model Butterfly RTM Oddball
Community Tools: SNARE • Problem: Given a network and some domain knowledge about suspicious nodes (flags), determine which nodes are most risky. • Data: Accounting transaction data. Nodes are accounts, edges are transactions between accounts. Accounts Payable Revenue Accts Accounts Receivable
Community Tools: SNARE • Example: “Channel stuffing” • Some accounts overstated • But other accounts also involved. • Since many accounts are slightly affected, it is easy to cover up activity. Very risky Accounts Payable Revenue Accts Accounts Receivable Not risky
Community Tools: SNARE • Social Network Analytic Risk Evaluation • Use domain knowledge to flag certain nodes. • Assume homophily between nodes (“guilt by association”) • Then, using initial risk as initial node potentials, use belief propagation (message passing between nodes) to determine end risk scores.
Community Tools: SNARE • Belief Propagation • Flags are node potentials, or “intial risk scores” • All nodes send messages back and forth with beliefs • Upon convergence, end result will reflect “riskiest” nodes. Before After Accounts Payable Revenue Accts Accounts Receivable