Download
1 / 16
160 likes | 308 Views
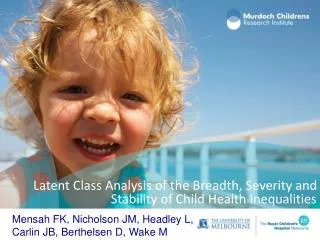
Latent Class Analysis of the Breadth, Severity and Stability of Child Health Inequalities . Mensah FK, Nicholson JM, Headley L, Carlin JB, Berthelsen D, Wake M. NHMRC Capacity Building Grant, MCRI, RCH and University of Melbourne Professors Melissa Wake, John Carlin

E N D
Latent Class Analysis of the Breadth, Severity and Stability of Child Health Inequalities Mensah FK, Nicholson JM, Headley L, Carlin JB, Berthelsen D, Wake M
NHMRC Capacity Building Grant, MCRI, RCH and University of Melbourne Professors Melissa Wake, John Carlin Professor Jan Nicholson, Parenting Research Centre, Melbourne Liz Headley, Victorian Public Health Training Scheme and Monash University Professor Donna Berthelsen, Queensland University of Technology Gender Equality Network, Economic and Social Research Council UK Dr Wendy Sigle-Rushton, London School of Economics Professors John Hobcraft and Kathleen Kiernan, Department of Social Policy and Social Work and Institute of Effective Education, University of York Acknowledgments
Multiple Outcomes of Health Inequality Models have often focused on single outcomes • fail to consider breadth of impact and address “multifinality” Alternative strategies • summary indices • multiple outcome models Example to follow: Impact of socioeconomic position on children’s risks for multiple problems in physical, socio-emotional and cognitive functioning
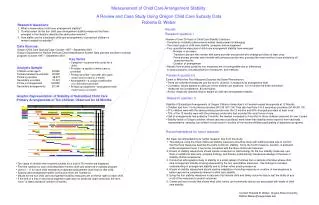
Two national cohorts of ~5,000 children each Infants (0-1 yrs) & Kindergarten children (4-5 yrs) in 2004 Followed up every two years Conducted by Australian Govt. Department of Families, Housing, Community Services and Indigenous Affairs (FaHCSIA), Australian Institute of Family Studies (AIFS), and the Australian Bureau of Statistics (ABS) with advice from a national research consortium www.aifs.gov.au/growingup/ The Longitudinal Study of Australian Children (LSAC)
Physical, Psychosocial and Cognitive Difficulties at 4-5 (Birth cohort)
Latent Class Analysis (LCA) • Groups children to reflect key differences • Accounts for inter-correlations between measures • Similar to cluster analysis, but is model based (probabilistic) • Gives model fit statistics to determine number of categories • Uses specialist software such as Mplus E.g. Multiple problem behaviours in adolescence Fergusson et al. 1994, Journal of Child Psychology & Psychiatry 35 (6) 1123-1140 Subtypes and severity of peer victimisation Nylundet al. 2007, Child Development 78 (6) 1706-1722
Classification (K cohort age 4-5) ESTIMATED CLASS PROPORTIONS AND COUNTS CLASSIFICATION QUALITY (Entropy) 0.809 CLASSIFICATION OF INDIVIDUALS BASED ON THEIR MOST LIKELY LATENT CLASS MEMBERSHIP
A further technique for classification after LCA Technique of random draws on the basis of probabilities http://www.statmodel.com/download/meantest2.pdf Takes into account both bias and uncertainty Similar principles to multiple imputation Implemented in Mplus as a default Can also be implemented in Stata Feeds into descriptive analysis and regression models
Conclusions, continuation and discussion Clear and reproducible groups reflecting degree of difficulties Powerful social grading Strong continuity from early to mid-childhood Potential to examine predictors, prognosis and associated costs For discussion: Criteria for evaluating validity Utility of this type of indicator beyond academic research