Download
1 / 36
360 likes | 553 Views
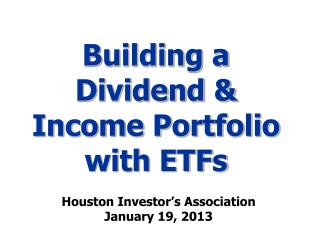
Building a Dividend & Income Portfolio with ETFs. Houston Investor’s Association January 19, 2013. Ron Rowland President, Capital Cities Asset Management Investment Management Services Editor, AllStarInvestor.com Publisher of subscription newsletters

E N D
Building a Dividend & Income Portfolio with ETFs Houston Investor’s Association January 19, 2013
Ron Rowland President, Capital Cities Asset Management Investment Management Services Editor, AllStarInvestor.com Publisher of subscription newsletters Founder, InvestWithAnEdge.com ETF analysis and market commentary Content widely syndicated to: SeekingAlpha, TheStreet.com, & others
Accumulation Distribution Instead of optimizing for growth, the need for a reliable and growing income stream often becomes the priority. Building a portfolio having these attributes is now feasible using ETFs. However, with more than 200 dividend and income ETFs, you must exercise care when building a sound diversified portfolio that meets your objectives.
3 Reasons To Be Here • Understand the risks of the 4 primary approaches to living off your portfolio • Learn about the hidden risks of dividend investing • Improve your confidence in selecting dividend ETFs
3 Things You Will Learn • The 12+ categories of dividend & income ETFs • Why you have to look at more than yield data • Putting it all together - your portfolio
Living Off Your Portfolio • 1: Put in bank and live off the interest • Not bad when banks paid 8% interest • Might appear to be the safest, but the current low interest rate environment dooms this to failure. • FDIC limitations, bank CDs paying less than 1%. • Even if you stretch this definition to include 30-year Treasury bonds, you would be locking in just 2.7% per year for the next 30-years. Adjusted for taxes, leaves you with very little, and adjusted for inflation quickly puts you in the hole.
Living Off Your Portfolio 2: Immediate Annuity Approach that most resembles a pension plan. You hand over your nest egg (lose control of funds) to an insurance company and they agree to pay you a fixed amount for as long as you live. Payments may sound attractive at first – 7.0% to 7.5% for life for a 65-year old person or 6.0% to 6.5% for a 65-year old couple, but those rates have no inflation adjustment, heirs get nothing, and the insurance company needs to live as long as you do (based on 12/31/11 prevailing rates).
Living Off Your Portfolio 3: Total Return Portfolio Traditional approach typically based on 60% stock / 40% bond portfolio. Requires partial position liquidations and annual rebalancing. Can be used in conjunction with 4% Rule (assumes your first year 4% withdrawal will grow each year to offset inflation). Research shows there is a small chance you could outlive your portfolio if the next 20-30 years turn out to be a worse-case market return scenario.
Living Off Your Portfolio 4: Dividend Growth Portfolio Proponents argue annual withdrawals should consist only of the dividends and interest without the need to ever sell anything. Assumes the growth of the dividends will offset the effects of inflation. A risk with this approach is that companies with steady dividend growth don’t yield the initial 4% needed in the first year. Higher yielding investments can reduce their dividends in tough economic times.
Why You Have To Look At More Than Just Yield iShares DJ Select Dividend ETF (DVY) 2007 Yield = 3.3% 2008 Yield = 3.7% 2009 Yield = 4.0% 2010 Yield = 3.9% “Dividend ETFs maintained their yield throughout the financial crisis.”
Why You Have To Look At More Than Just Current Yield “Dividend ETFs maintained their yield throughout the financial crisis.” Very deceiving. Current yield matters only to someone buying that day. Actual payouts to owners dropped significantly, about the same as prices, producing steady appearing yields.
What Really Happened to Dividend Funds Current yield data from ETF Field Guide (6/30/12) Annual dividend payments from Morningstar (12/31/11)
Why You Have To Look At More Than “Current” Yield iShares DJ Select Dividend ETF (DVY) Current Year Yield PayoutYield on Cost* 2008 3.7% $2.42 3.7% 2009 4.0% $1.66 2.6% 2010 3.9% $1.70 2.6% 2011 3.8% $1.91 3.0% * Assumes investment 12/31/07 at $64.49
Flavors of Dividend & Income ETFs Core Dividend Funds iShares DJ Select Dividend (DVY) SPDR S&P Dividend (SDY) Dividend Growth Vanguard Dividend Appreciation (VIG) High Yield Equity Vanguard High Dividend Yield (VYM) iShares High Dividend Equity (HDV) Targeted Cap Dividend WisdomTree Small Cap Dividend (DES) WisdomTree Mid Cap Dividend (DON)
Flavors of Dividend & Income ETFs Strategies with Dividends PowerShares S&P 500 Low Volatility (SPLV) Foreign Dividend PowerShares International Div Achievers (PID) iShares DJ International Select Dividend (IDV) Emerging Market Dividend WisdomTree Emg Mkts Equity Income (DEM) EGShares Emg Mkts High Div Low Vltly (HILO) REITs iShares DJ US Real Estate (IYR) SPDR DJ International Real Estate (RWX) SPDR DJ Global Real Estate (RWO)
Flavors of Dividend & Income ETFs MLPs JPMorgan Alerian MLP Index ETN (AMJ) ETRACS Alerian Infrastructure ETN (MLPI) Commodity Exposure Dividends Market Vectors Junior Gold Miners (GDXJ) Guggenheim ABC High Dividend ETF (ABCS) Utilities Sector Vanguard Utilities (VPU) iShares MSCI ACWI ex-US Utilities (AXUT) Telecommunications Sector Vanguard Telecommunications (VOX) iShares MSCI ACWI ex-US Telecom (AXTE)
Flavors of Dividend & Income ETFs BDCs – Business Development Cos. PowerShares Global Listed Private Equity (PSP) ETRACS Wells Fargo BDC ETN (BDCS) Preferreds SPDR Wells Fargo Preferred Stock (PSK) iShares S&P US Preferred Stock (PFF) Global X Canada Preferred (CNPF) Convertible Bonds PowerShares Convertible Securities (CVRT) SPDR Barclays Convertible Securities (CWB) ETF of Closed End Dividend Funds PowerShares CEF Income Composite (PCEF)
Flavors of Dividend & Income ETFs High Yield (“Junk”) Bonds iShares iBoxx $ High Yield Corp (HYG) SPDR Barclays High Yield Bond (JNK) PowerShares Fundamental High Yld Crp (PHB) Guggenheim BulletShares 2014 HY Bond (BSJE) Investment Grade Bond iShares iBoxx $ Investment Grade Corp (LQD) PowerShares Build America Bonds (BAB) SPDR Barclays Issuer Scored Corp Bond (CBND) Guggenheim BulletShares 2014 Corp Bd (BSCE) International Bonds SPDR Barclays International Treasury (BWX) SPDR Barclays International Corp Bnd (IBND)
Flavors of Dividend & Income ETFs Emerging Markets Bonds iShares JPMorgan USD Emg Mkt Bonds (EMB) Market Vectors Emg Mkt Local Curr Bd (EMLC) WisdomTree Emg Mkt Corp Bond (EMCB) Muni Bonds iShares S&P National AMT-Free Muni (MUB) iShares 2014 S&P AMT-Free Muni (MUAC) High Yield Muni Market Vectors High-Yield Municipal (HYD) ETF of Closed End Muni Funds Market Vectors CEF Municipal Income (XMPT)
Other Dividend ETF Risks Sector Concentration (as of 12/31/12) DVY 31% in Utilities VIG 27% in Consumer Staples FDL 30% in Utilities PID 21% in Telecom HDV 21% in Health Care PFF 100% in Financial Services
Improving Your Confidence When Selecting Dividend ETFs You have to look at more than yield Look at historical annual payouts You have to look at more than names Look at sector weightings Maintain awareness of other risks Dividend Indexes have survivor bias Look at price volatility Don’t “lock-in” low interest rates
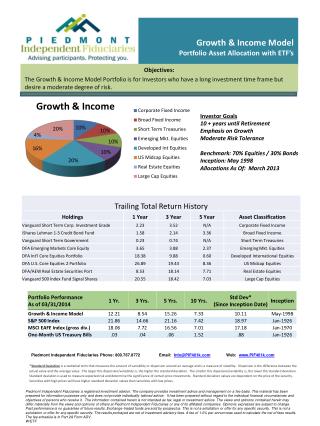
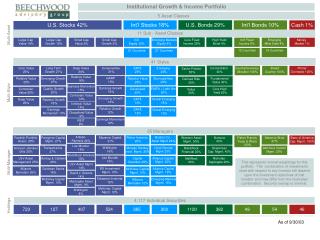
Portfolio Approach Higher Yield & Lower Risk Yield = 12-month trailing yield, supplied by Morningstar as of 12/31/12. Std Dev = annualized standard deviation of daily returns for 2012. MDD = Maximum drawdown during calendar year 2012. Std Dev and MDD data calculated in AmiBroker using FastTrack data.
Analysis of ETF Dividend & Income Model All Star Investor Morningstar 12/31/12 Data
Regional Exposure
Key Portfolio Components Vanguard Dividend Appreciation (VIG) Largest holding at 15%, yield only 2.2% PowerShares S&P 500 Low Volatility (SPLV) Non-dividend fund with 3.5% yield WisdomTree Emg Mkts Equity Inc (DEM) Long-term growth + 4% yield JPMorgan Alerian MLP ETN (AMJ) Energy sector exposure with ~6% yield PowerShares CEF Income Composite (PCEF) Buys at discount, sells at prem, 7% yield Guggenheim BulletShares HY 2013,14,15,16 Reduced risk junk ladder – fresh funds
Portfolio Customization Concepts 4% Rule is only a starting point You may require more or less Equity portion is 66% US & 33% foreign These ratios can be adjusted Conservative Sector Exposure Convertibles can increase Tech exposure Tax-sensitive Variation Substitute target maturity muni ETFs Current Income vs Income Growth Adjust to meet your specific needs
Portfolio Plans For 2013 Put Accumulated Cash to Work Leading candidates: FT Technology Dividend (TDIV) ALPS Sector Dogs (SDOG) WisdomTree Small Cap Div (DES) Roll 2013 HY BulletShares to 2017 Sooner rather than later Monitor Current Positions Performance, sector+geographic exposure Rebalance If required and if economical
3 Levels of Service 1) Free:Invest With An Edge newsletter ETF DeathwatchETF Monthly StatsETF reviews Online content at InvestWithAnEdge.com 2) Subscription:AllStarInvestor.com newsletter ETF Dividend & Income ETF Strategic Allocation ETF Tactical Growth ETF Sector Rotation Extensive Rankings 3) Investment Management Personal account management via Registered Investment Advisor affiliate: Capital Cities Asset Management
Established in 1993 • Registered Investment Advisor • Innovative Portfolio Management Services • Use Independent Custodians • Fiduciary Responsibility & Personalized Service
Free Special Report Available at www.ccam.com
Special Offer – Today Only Free to Attendees 76-Page PDF 1,476 ETFs & ETNs User’s Guide (15 pages) 8 Major Sections 80 Categories Expense Ratio, Yield Tax Form, Inception 4 Performance Metrics 3 Risk Metrics 3 Liquidity Metrics 40+ Blue Star Awards H Fill out and hand in card to receive your pdf via email.
Offices located in Austin, Texas Capital Cities Asset Management Inc. 11651 Jollyville Rd., Ste 200 (800) 767-2595 (512) 219-7566 www.ccam.com AllStarInvestor.com (800) 299-4223 (512) 219-1183 www.investwithanedge.com www.allstarinvestor.com
Disclosures Past performance is not a guarantee of future results. All investments involve risk and there is always the possibility of incurring a loss as well as the potential for profits. Ron Rowland, along with clients and employees of CCAM, utilize the strategies presented here and will typically hold positions in any securities recommended. Performance data for Capital Cities Asset Management (CCAM) examples are based on the composite of all accounts under management that were in the referenced investment program for the entire quarter and includes reinvestment of all dividends and distributions. Reduction due to management fees has been accounted for. The performance of individual accounts will vary from the composites presented. Performance results for All Star Investor are not representative of those achieved by clients of CCAM due to differences in security selection, timing of trades, transaction fees, and CCAM’s management fees. It should not be assumed that investments made in the future will be profitable or will equal the performance of the securities mentioned or that the mentioned investments were or will be profitable. The securities discussed do not reflect all recommendations in this investment category, but a complete list of recommendations for the past year will be provided upon request.