Download
1 / 25
250 likes | 471 Views
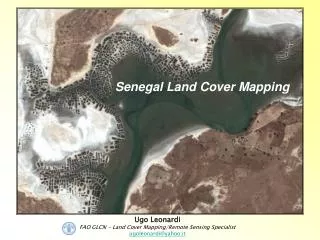
European land cover mapping. Stefan Kleeschulte European Topic Centre on Terrestrial Environment . Corine Land Cover (CLC). Scale 1:100.000, seamless vector database 44 classes in 3 hierarchical levels 25 ha Minimum Mapping Unit (MMU) 5 ha MMU for land cover changes +/- 30 countries

E N D
European land cover mapping Stefan Kleeschulte European Topic Centre on Terrestrial Environment
Corine Land Cover (CLC) • Scale 1:100.000, seamless vector database • 44 classes in 3 hierarchical levels • 25 ha Minimum Mapping Unit (MMU) • 5 ha MMU for land cover changes • +/- 30 countries • Extension to Norway, Switzerland, Turkey & Iceland
Comparison Europe – U.S. Europe 3.6 Mio km2 United States (Lower 48) 7.8 Mio km2 Source: CLC2000 Source: NLCD Land Cover Statistics
Methodology Ortho-rectified satellite image database (JRC) Visual image interpretation (national teams) Verification – qualitative (ETC/TE) Final vector database (national team) European Data integration – vector & raster (ETC/TE) Validation – quantitative (ETC/TE)
History CLC1990 Process from 1985 to 1995 10-year process Growing process No common data policy CLC2000 Coordinated approach Snapshot (2000 +/- 1 year) 29 countries Agreed data policy for image and mapping data Output: CLC2000 CLC changes CLC90 corrected
Validation of European CLC data • Need for an independent database • LUCAS – Land Use land Cover Area Sampling • Statistical sampling grid • Similar timeframe • 10.000 points over Europe (18 countries) • Field survey of land use and land cover • Field photographs • Re-interpretation of field photographs
Validation results Display of LUCAS points on IMAGE2000 Interpretation of point from satellite image and field photographs Creation of error matrix Overall accuracy: 87.0% ± 0.8%
CLC - a success story • Number of downloads from EEA web site • Applications • Value of downstream applications
Corine land cover downloads from http://dataservice.eea.eu.int CLC2000
Use of Corine Land Cover Breakdown per economic sector Investment cost CLC2000: 13 Meuro Estimated revenues generated by underpinning downstream activities using CLC:250 Meuro* *Based on analysis of 500 activities out of 5658 registered users
IMAGE2000 User statistics* *Source: JRC, 2006 (Summer 2005 – April 2006)
Example: Green urban areas(based on IMAGE2000) Budapest Barcelona Athens Copenhagen free access Source: EEA (2006)
Example: Population density(based on CLC and Eurostat) + = free access Source: EEA, JRC (2005)
Issues Impacts of land use planning on flooding The 2002 Millennium floodaffected 4.2 million people Between 1980–2000 urban land augmented 20 % while population increased only 6 %
Nature protection and halting loss of biodiversity (2010 target) Issues Points of possible traffic conflict 2000 (Estonia) Planning green corridors 2010 (Estonia)
Land cover change accounts: from maps to statistics Land cover 1990 & 2000 and land cover change are first converted to a grid (below, 3x3 km) LCF1 Urban land management LCF2 Urban residential sprawl LCF3 Sprawl of economic sites and infrastructures LCF4 Agriculture internal conversions LCF5 Conversion from other land cover to agriculture LCF6 Withdrawal of farming LCF7 Forests creation and management LCF8 Water bodies creation and management LCF9 Changes due to natural & multiple causes Individual changes are grouped by land cover flows that describe processes
CLC2006 update • Highly requested by European Commission and EEA Member States • High interest in land cover changes • More frequent updates (< 10 years) • Improved data content (e.g. urban) • Integration into GMES • Reliable, up-to-date and accessible information on the environment for Europe • GMES Fast Track Service on Land (delivery 2008) • CLC2006 update • 2 high-resolution layers
Proposed funding blocks In-situ data CLC2006 interpretation Validation High resolution layers Satellite images Total estimate: 14 Meuro
Concept of GMES services on land monitoring based on EU and National user requirements Earth Observation In situ monitoring Core land cover data service Public funding Downstream services Industry services
GMES FTS Land first set of core land cover data products CLC 2006 Built-up area / sealing CLC Changes
Products to deliver in 2008 • Ortho-rectified satellite images for the reference year 2006 (+/- 1 year); • European mosaic based on ortho-rectified satellite imagery (IMAGE2006); • Corine land cover changes 2000-2006; • Corine land cover map 2006 (CLC2006); • High resolution built-up areas including degree of soil sealing 2006; • High resolution forest mask 2006.
Agreed boundary conditions during preparatory work 2005-2006
Thank you for your interest In case of questions: stefan.kleeschulte@uab.es