Download
1 / 14
140 likes | 163 Views
Step-by-step guide on using programs for data analysis and event detection with detailed instructions and screenshots.

E N D
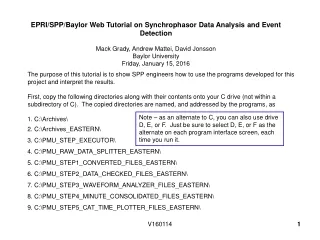
The purpose of this tutorial is to show SPP engineers how to use the programs developed for this project and interpret the results. • First, copy the following directories along with their contents onto your C drive (not within a subdirectory of C). The copied directories are named, and addressed by the programs, as • C:\Archives\ • C:\Archives_EASTERN\ • C:\PMU_STEP_EXECUTOR\ • C:\PMU_RAW_DATA_SPLITTER_EASTERN\ • C:\PMU_STEP1_CONVERTED_FILES_EASTERN\ • C:\PMU_STEP2_DATA_CHECKED_FILES_EASTERN\ • C:\PMU_STEP3_WAVEFORM_ANALYZER_FILES_EASTERN\ • C:\PMU_STEP4_MINUTE_CONSOLIDATED_FILES_EASTERN\ • C:\PMU_STEP5_CAT_TIME_PLOTTER_FILES_EASTERN\ Note – as an alternate to C, you can also use drive D, E, or F. Just be sure to select D, E, or F as the alternate on each program interface screen, each time you run it. EPRI/SPP/Baylor Web Tutorial on Synchrophasor Data Analysis and Event Detection Mack Grady, Andrew Mattei, David Jonsson Baylor University Friday, January 15, 2016 V160114 1
A Quirk of Visual Basic. Most of the programs contained here require minutes, or sometimes hours, to run. A quirk of Visual Basic is that when running a clicked command, VB will not respond to keystrokes until the previous click command has finished. Until finished, VB will respond with a “Not Responding” message. For that reason, the best method to observe progress is to observe the list of hourly output files produced by the program. • Three Test Hours. For purposes of this tutorial, we will deal with only three hours. These hours had interesting events in the latest weekly report. They are • January 04, 2016, Hour 21:00 UTC • January 05, 2016, Hour 12:00 UTC • January 07, 2016, Hour 17:00 UTC V160114 2
Begin by splitting three hourly “raw data” files that contain all Baylor’s PMU data, 30 lines per second, and includes PMUs in all three US grids. The splitting process extracts hourly raw data for one grid, in this case EASTERN. Within directory C:\PMU_STEP_EXECUTOR\, double-click on “PMU_RAW_DATA_SPLITTER_EASTERN.exe”. The following form will appear. Make sure that “Grid Output Eastern Only” is selected Make sure that “Input Drive C” is selected Click “1. CHECK PATH” With “2. Start File” already selected, click the desired Starting File from “Files in Directory” Select “3. Stop File” and then click the desired Stop File from “Files in Directory” Click “4. BEGIN”. Execution time is approx. 5 seconds per hourly file. Note – ordinarily you will not perform this step because the files you download from Baylor have already been split and tagged with “_EASTERN”. The purpose of this slide is to show you how we do it. V160114 3
Step 1. Check for errors and discrepancies in the hourly raw data files, and convert them to the format used by Baylor’s analysis and event detection programs • Within directory C:\PMU_STEP_EXECUTOR\, double-click on “PMU_STEP1_RAW_DATA_CONVERTER_EASTERN.exe”. • Key portions of the form that appears on the PC screen are shown below. • Make sure that “Grid Output Eastern Only” is selected, and that “Input Drive C” is selected. • Click “1. Check File Paths” • Click “2. Read and Check Headers” • Click “3. Sort” • Click “4. Convert Files”. Execution time is approximately 8 seconds per hourly file. V160114 4
Step 2. Prepares minute-by-minute summaries including average, max, and min readings, and number of dropouts for each PMU. Minute summaries are most useful for determining overall data acquisition performance, identifying PMU and internet problems, and for producing weekly summary plots. • Within directory C:\PMU_STEP_EXECUTOR\, double-click on “PMU_STEP2_DATA_CHECKER_EASTERN.exe”. • Key portions of the form that appears on the PC screen are shown below. • Make sure that “Grid Selection EASTERN” is selected, and that “Input Drive C” is selected. • Click “1. Check Paths and Files” • In the “2. Select Day(s)” listbox, click on any hour of the days you wish to check. • Click “3. Run Multiple Days”. Execution time is approximately 1 minute per hourly file. V160114 5
Step 3. At this point, we are ready to harvest the crop yielded by the previous steps by scanning through hourly files, viewing minute graphs, and detecting events. • Within directory C:\PMU_STEP_EXECUTOR\, double-click on “PMU_STEP3_WAVEFORM_ANALYZER_EASTERN.exe”. • Key portions of the form that appears on the PC screen are shown below. • Make sure that “Grid EASTERN” is selected, and that “Input Drive C” is selected. • Click “Check File Paths”. • Click any hour in the listbox below instruction “Click an Hour and Wait Approx. 1 Minute …”. • After a minute of that hour is displayed, you can then request a full-screen view by checking “Show Detail Graphs”. • Click on any minute of the same hour to view that minute. The minute listbox is immediately below the hourly listbox. V160114
Step 3, cont. • When ready for event screening, uncheck DC (very far away), SPP2 (offline), and SPP6 (near SPP5). This will speed up the screening process. • Then, check “Hold off on auto PMU include changes”. This will prevent DC, SPP2, SPP6 from coming back on each time a new hour is screened. • To screen the entire hour, click “Screen the Hour for Events”. Execution time is approximately 2 minutes per hourly file. • To scan entire days, click “Screen Multiple Days”. Consistent with the previous statement, execution time is approximately 50 minutes per day, and 6 hours per week. V160114 8
Step 3, cont. Events flagged during the present run, or during past runs, can be viewed minute-by-minute by clicking the desired event in the bottom-right listbox. “Keepers” are usually designated by “CAT1_02” or higher number such as _03, _04, etc. The number indicates how many PMUs flagged the minute. The same applies to CAT2 and CAT3 events. CAT2 focuses on higher-frequency events than CAT1. CAT3 is like CAT1 except that it uses more sensitive event triggers. Once an event is selected from the event listbox, the program stays event viewing mode until closed and restarted. To view the event trigger settings, click “Open Event Setting Screen”. V160114 9
Step 3, cont. Event triggers are shown below and will be described during the tutorial. The same triggers are used for both EASTERN and ERCOT, except that the low-frequency trigger for ERCOT is 59.93 Hz instead of 59.95 Hz. V160114 10
Step 4takes the 1-minute averages produced by Step 2 and prepares them for pasting into an Excel spreadsheet that produces the 1-week graphs included in the weekly emails. Step 4 is not the “brain” behind event detection but is definitely helpful. • Within directory C:\PMU_STEP_EXECUTOR\, double-click on “PMU_STEP4_MINUTE_AVERAGE_CONSOLIDATOR_EASTERN.exe”. • Key portions of the form that appears on the PC screen are shown below. • Make sure that “Grid EASTERN” is selected, and that “Input Drive C” is selected. • Checkbox “3. Screen for Names Only?” remains checked for now. • Click “1. ENABLE FILE LIST”. • Click “2. DO ALL”. Wait 10-20 seconds until finished. • Uncheck “3. Screen for Names Only?”. • Click “4. DO ALL”. Wait approximately 1 minute until finished. V160114 11
Step 4, cont. The output of Step 4 is pasted into a spreadsheet which produces weekly graphs, one of which is shown below. V160114 12
Step 5 is a time plotter that is intended for continuous operation to show 24 hours of event timeline so that “hot periods” become visually obvious. Adjacent minute events are also easily spotted. • Within directory C:\PMU_STEP_EXECUTOR\, double-click on “PMU_STEP5_CAT_TIME_PLOTTER_EASTERN.exe”. • Key portions of the form that appears on the PC screen are shown below. • Make sure that “Grid Output EASTERN” is selected, and that “Input Drive C” is selected. • Click “1. PATH CHECK” • Click “2. READ AND PLOT” V160114 13
When running automatically, the 24 hour display ends with the most recent hour Click to view any day in the directory Step 5, cont. Event Category Timeline, 24 Hours, January 09, 2016, UTC V160114 14