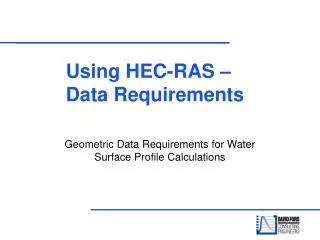
Using HEC-RAS –Data Requirements
Using HEC-RAS –Data Requirements. Geometric Data Requirements for Water Surface Profile Calculations. Example Schematic. Where do we need cross sections?. At changes in discharge - stream confluences At changes in slope At changes in shape At changes in roughness

Using HEC-RAS –Data Requirements
E N D
Presentation Transcript
Using HEC-RAS –Data Requirements Geometric Data Requirements for Water Surface Profile Calculations
Where do we need cross sections? • At changes in discharge - stream confluences • At changes in slope • At changes in shape • At changes in roughness • At control points - Critical Depth • At levees, bridges, culverts, and other features
Study Limit Determination • Evaluate upstream and downstream impacts of alternatives. • Establish limits for data collection and analysis • Upstream Limits - Upper study boundary plus additional distance where profile resulting from a structure-caused energy loss converges with the existing condition profile. • Downstream Limits - Start sufficiently far downstream to assure accurate results at the lower limit of the study reach.
Upstream Reach Length Determination Lu = Distance upstream HD = Avg. hydraulic depth for Q100 HL = Headloss at the structure for Q100 S = Average reach slope Some guidance from HEC
Downstream Reach Length Determination Some guidance from HEC Ld = Distance downstream HD = Avg. hydraulic depth for Q100 S = Average reach slope
Surveyed Cross Section Data Approximation to actual channel
Ineffective Area Limits of a Floodplain (3 XS)
Ineffective Area Limits of a Floodplain (4 XS)
Ineffective Area Limits of a Floodplain
Ineffective Area Cross Sections on Floodplain
Reach Lengths Reach lengths represent the distance between adjacent cross sections. They represent the flow path length for the center of mass of the fluid in each subsection.
Energy Loss Coefficients The program utilizes loss coefficients to evaluate energy losses: • Manning's n values for friction loss • Contraction and expansion coefficients to evaluate transition (shock) losses.
Manning’s n Value Factors affecting the n value: • -Surface Roughness • - Geometry Irregularity • - Land Use - Vegetation • - Degree of Meandering • - Scour and Deposition • - Flow Obstructions • - Bed Forms
Manning’s n Value Sources of Information for Estimating Manning’s n • Published Documents (text books, USGS docs • Field Observations • Formulas for n-value (Jarrett, Limerinos, etc.) Calibration to Observed Data • Need high water and flow data
Contraction and Expansion Coefficients Some typical values
Ineffective Flow Areas Left Ineffective Flow Station Right Ineffective Flow Station
Levee Option Left Levee Station
Levee Added Left Levee Station and Elevation
Stream Junction Stream junctions are defined as locations where two or more streams come together or split apart. Junction data consists of reach lengths across the junction (and tributary angles, if the momentum equation is selected). Reach lengths across the junction are entered in the Junction Data Editor
Steady Flow Data Options • Insert a Known Water Surface • Enter and Additional Energy Loss • Enter Observed Water Surfaces for Comparison • A flow is required at every cross section (but you need to enter values only 1) at the upstream boundary 2) where the flow changes)
Flow Regime Types • Critical Flow Fr = 1 • Subcritical Flow Fr < 1 • Supercritical Flow Fr > 1
Flow Transitions • Establishment of Uniform Flow • What is Uniform Flow? • Chezy Equation: • Manning’s Equation: Note: C is not dimensionless
Required Boundary Conditions • Subcritical Flow Regime Downstream only • Supercritical Flow Regime Upstream only • Mixed Flow Regime Both upstream and downstream
Types of External Boundary Conditions • Known water surface elevation • Critical depth • Normal depth (also called slope area - based on Manning's equation) • Rating curve
Discharge Information • Tributary inflows • Local inflow • Lateral weir flows • Account for hydrograph attenuation
Steady Flow Data Options • Specify a change in energy • Specify a change in water surface • Insert a known water surface • Enter an additional energy loss • Enter observed water surfaces for comparison