Download
1 / 1
10 likes | 183 Views
Factors affecting milk ELISA scores of cows tested for Johne’s disease H. D. Norman 1 , J. R. Wright 1 *, and T. M. Byrem 2 1 Animal Improvement Programs Laboratory, Agricultural Research Service, USDA, Beltsville, MD 20705-2350 2 Antel BioSystems, Lansing, MI 48910-3815. Abstr. W7. 2009.

E N D
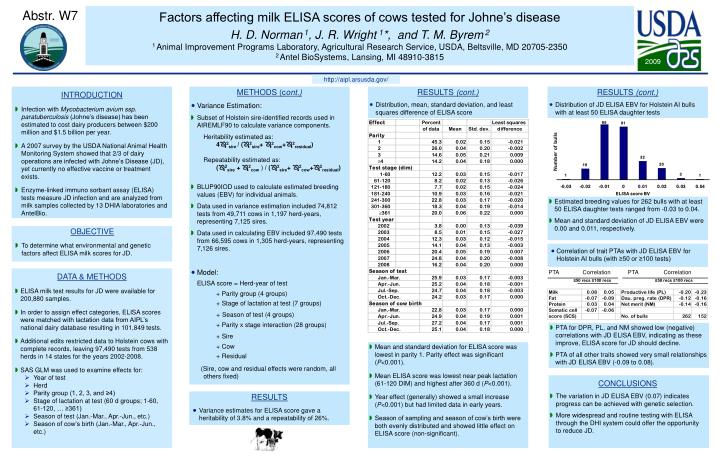
Factors affecting milk ELISA scores of cows tested for Johne’s disease H. D. Norman1, J. R. Wright1*, and T. M. Byrem2 1Animal Improvement Programs Laboratory, Agricultural Research Service, USDA, Beltsville, MD 20705-2350 2Antel BioSystems, Lansing, MI 48910-3815 Abstr. W7 2009 http://aipl.arsusda.gov/ RESULTS (cont.) • Distribution of JD ELISA EBV for Holstein AI bulls with at least 50 ELISA daughter tests INTRODUCTION • Infection with Mycobacterium avium ssp. paratuberculosis (Johne’s disease) has been estimated to cost dairy producers between $200 million and $1.5 billion per year. • A 2007 survey by the USDA National Animal Health Monitoring System showed that 2/3 of dairy operations are infected with Johne’s Disease (JD), yet currently no effective vaccine or treatment exists. • Enzyme-linked immuno sorbant assay (ELISA) tests measure JD infection and are analyzed from milk samples collected by 13 DHIA laboratories and AntelBio. METHODS (cont.) • Variance Estimation: • Subset of Holstein sire-identified records used in AIREMLF90 to calculate variance components. Heritability estimated as: • 42sire / (2sire+ 2cow+2residual) Repeatability estimated as: • (2sire + 2cow ) / (2sire+ 2cow+2residual) • BLUP90IOD used to calculate estimated breeding values (EBV) for individual animals. • Data used in variance estimation included 74,812 tests from 49,711 cows in 1,197 herd-years, representing 7,125 sires. • Data used in calculating EBV included 97,490 tests from 66,595 cows in 1,305 herd-years, representing 7,126 sires. • Model: ELISA score = Herd-year of test + Parity group (4 groups) + Stage of lactation at test (7 groups) +Season of test (4 groups) + Parity x stage interaction (28 groups) + Sire + Cow + Residual (Sire, cow and residual effects were random, all others fixed) RESULTS (cont.) • Distribution, mean, standard deviation, and least squares difference of ELISA score Number of bulls • Estimated breeding values for 262 bulls with at least 50 ELISA daughter tests ranged from -0.03 to 0.04. • Mean and standard deviation of JD ELISA EBV were 0.00 and 0.011, respectively. OBJECTIVE • To determine what environmental and genetic factors affect ELISA milk scores for JD. • Correlation of trait PTAs with JD ELISA EBV for Holstein AI bulls (with ≥50 or ≥100 tests) DATA & METHODS • ELISA milk test results for JD were available for 200,880 samples. • In order to assign effect categories, ELISA scores were matched with lactation data from AIPL’s national dairy database resulting in 101,849 tests. • Additional edits restricted data to Holstein cows with complete records, leaving 97,490 tests from 538 herds in 14 states for the years 2002-2008. • SAS GLM was used to examine effects for: • Year of test • Herd • Parity group (1, 2, 3, and ≥4) • Stage of lactation at test (60 d groups; 1-60, 61-120, … ≥361) • Season of test (Jan.-Mar., Apr.-Jun., etc.) • Season of cow’s birth (Jan.-Mar., Apr.-Jun., etc.) PTA Correlation PTA Correlation ≥50 recs ≥100 recs ≥50 recs ≥100 recs • PTA for DPR, PL, and NM showed low (negative) correlations with JD ELISA EBV, indicating as these improve, ELISA score for JD should decline. • PTA of all other traits showed very small relationships with JD ELISA EBV (-0.09 to 0.08). • Mean and standard deviation for ELISA score was lowest in parity 1. Parity effect was significant (P<0.001). • Mean ELISA score was lowest near peak lactation (61-120 DIM) and highest after 360 d (P<0.001). • Year effect (generally) showed a small increase (P<0.001) but had limited data in early years. • Season of sampling and season of cow’s birth were both evenly distributed and showed little effect on ELISA score (non-significant). CONCLUSIONS • The variation in JD ELISA EBV (0.07) indicates progress can be achieved with genetic selection. • More widespread and routine testing with ELISA through the DHI system could offer the opportunity to reduce JD. RESULTS • Variance estimates for ELISA score gave a heritability of 3.8% and a repeatability of 26%.