Dosing Regimen Individualization
Dosing Regimen Individualization. Age. Subcategories. Age of usual adult for whom the “usual adult regimen” is prescribed is 55 years. Confounding variables.

Dosing Regimen Individualization
E N D
Presentation Transcript
Subcategories Age of usual adult for whom the “usual adult regimen” is prescribed is 55 years.
Confounding variables Influence of age on pharmacokinetics is difficult to separate from the influence of body weight in the young, and from disease in adults.
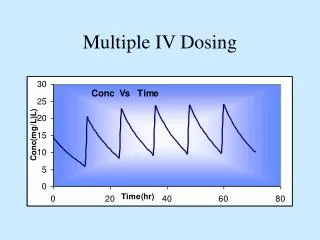
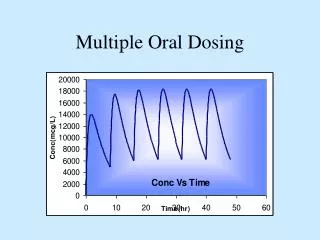
Cross-sectional vs. Longitudinal Study Designs Cross-sectional design: group subjects by age and compare PK parameter values in the different age groups: Age CL 10-20 aaa.a 21-30 bbb.b 31-40 ccc.c Longitudinal design: Repeatedly measure PK value in the same subjects over a long period of time.
Pitfall with cross-sectional design An apparent age-associated effect may be due to differences in longevity that also influence the PK parameter. Example: Effect of age on eye color. Assume the people with blue eyes also have a relatively short life span, but this is unknown at the time of the study. A cross-sectional study would indicate that the fraction of people with blue eyes declined with increasing age. Conclusion: eye color changes with increasing age. A longitudinal study would show the truth, that people with blue eyes did not live as long.
V and age: protein binding fup tends to be elevated in newborns and in the elderly. V values tend to be elevated for protein-bound drugs. • Review of literature for fup values measured in young and elderly subjects/patients found 106 studies for 66 drugs. • 28/106 studies showed fup elevated in the elderly • 7/106 studies showed fup decreased in the elderly • 71/106 studies showed no change for fup in the elderly Age-related changes [in adults] are usually not clinically important – Grandison and Boudinot. Grandison and Boudinot. Age-related changes in protein binding of drugs. Clin. Pharamacok. 38:271-290,2000.
Plasma Proteins , male; o, female. B. Th. Veering, et al. Br. J. clin. Pharmac. 29:201-206, 1990.
V and age: protein binding Ceftriaxone Hayton and Stoeckel. Age associated changes in ceftriaxone pharmacokinetics. Clin. Pharamacok. 11:76-86,1986.
Adiposity: increases as adults age • ~20% Body Weight in young adults • Age and Gender Dependent: • Children age 15 yr and below BF% = 1.51BMI – 0.70age –3.6Gen + 1.4 • Adults BF% = 1.2BMI + 0.23age –10.8Gen - 5.4 BMI = body mass index = BW/H2 (kg/m2)
Obesity and V Values log P = log [octanol / pH 7.4 buffer] partition coefficient
-Blockers and Obesity: V obese control log V = 0.23(0.04)log D + 2.1(0.07) log V = 0.25(0.05)log D + 2.2(0.07) G. Cheymol. Effects of obesity on pharmacokinetics. Clinical Pharmacokinetics 39:215-231,2000.
Obesity and V • General lack of correlation between V and log P is attributed in part to variability in the affinity of drug for lean tissue. • affinity for lean tissue is unrelated to log P and highly variable among drugs. • amine functional group seems to increase affinity for lean tissue. The difference between actual and ideal body weight in obesity is not all adipose tissue; 20-40% of the additional weight is lean.
CL and age: CLR 11,347 CLCR values from 5,146 subjects CLCR = [140 – age] W / 70 Hallynck T, Soep H, Thomis J, Boelaert J, Daneels R, Dettli L: Should Clearance be Normalised to Body Surface or to Lean Body Mass? Br. J. Pharmac. 11:523-526, 1981.
CLCR – longitudinal study, adults Baltimore longitudinal study of aging. 254 normal subjects; not taking diuretics or antihypertensives, and no renal or urinary tract disease. One-third had no decrease in renal function over time. Lindeman, et al. J. Amer. Geriatrics Soc. 33:278,1985.
CL and age: CLH n = 307 oxidative metabolism - 1% / yr Rowland and Tozer. Fig. 15.9, p. 239.
CLR and age: children cefetamet b = 0.661 Hayton, Stoeckel, et al. Antimicrob. Agents Chemother. 35:720-725, 1991; 40:567-574, 1996.
CLR cefetamet: age-weight model CLR,ma CLR CLR,im age
The least-squares fit of this equation to cefetamet CL values in children is indicated by the solid circles.
GFR: maturation and growth 63 healthy children age 2 d to 12 yr
GFR: maturation and growth From the maturation half life, children age 2 yr and older have fully mature renal function. DR need be adjusted only for body weight. The body weight adjustment should use the b value of 0.662; i.e., a body surface area adjustment is appropriate.
GFR: maturation and growth For children less than 2 yr of age, adjustment of the adult dosage must include adjustment for immaturity as well as for body size. 1. Divide through by W; this results in CLR per kg W. 2. Divide through by 1.43 mL min-1 kg-1 (adult GFR of 100 mL/min per 70 kg). This results in the fraction of the adult normal GFR for a child of weight W and age in months.
GFR: maturation and growth For a child less than 2 yr and a drug cleared primarily by the kidneys, 1) calculate FRACGFR: 2) Calculate the dosing rate as a fraction of the adult dosing rate:
Example The usual adult dosage for this antibiotic is 250 mg t.i.d. What should the regimen be for a 4 mo. old, 12 lb infant? FRACGFR = 5.44-0.338(5.69 – 3.87e-0.0882(4)) = 1.68 DM,infant = DM,adult x FRACGFR = (250 mg / 70 kg)(1.68) = 6.00 mg/kg DM,infant = 6.00 mg/kg x 5.44 kg = 32.6 mg t.i.d.
Features of the age,weight model • Degree of maturation is indicated by the ratio of c / a • 8.14 / 2.60 = 3.1 2. The time for maturation was characterized by the maturation half life; 3.3 t1/2,mat was about 2 yr. 3. The body weight exponent was 0.662, which suggests that BSA is the appropriate index for adjustment of the adult DR for children 2 yr of age and older.
Features, cont. 4. GFR per kg body weight is influenced positively by maturation and negatively by growth, over two time frames. usual adult value
GFR from birth to 100 yr GFR = (140 - age) W / 70 GFR (mL/min) = 2.60W0.662e-0.0882age + 8.14W0.662(1 - e-0.0882age) – (age/12)(W/70)0.662 age, mo.; W, kg
CLH and age: children S.N. de Wildt, et al., Cytochrome P450 3A ontogeny amd drug disposition. Clin. Pharmacok. 37:485-505,1999.
S.N. de Wildt, et al., Cytochrome P450 3A ontogeny amd drug disposition. Clin. Pharmacok. 37:485-505,1999.
Liver Volume and Drug CL vs. Age in Children Murry, Crom, … Evans. Drug Metab. Disp. 23:1110-1116, 1995
lorazepam eliminated primarily by glucuronidation p > 0.05 p > 0.05 Murry, Crom, … Evans. Drug Metab. Disp. 23:1110-1116, 1995
p < 0.05 antipyrine eliminated primarily by CYP450-mediated oxidation p > 0.05 Murry, Crom, … Evans. Drug Metab. Disp. 23:1110-1116, 1995
Indocyanine Green clearance. CL is by the liver and E 1. CLICG is widely used as a measure of hepatic blood flow. Murry, Crom, … Evans. Drug Metab. Disp. 23:1110-1116, 1995