Enhancing Learning Outcomes at Higher Education Institutions
350 likes | 450 Views
Learn about a model for measuring learning outcomes and strategies for improving preparation, decreasing remediation, and supporting economic development in higher education. Explore data trends and initiatives to enhance funding and governance in academia.

Enhancing Learning Outcomes at Higher Education Institutions
E N D
Presentation Transcript
A Model for Measuring Learning Outcomes Jim Purcell Louisiana Commissioner for Higher Education
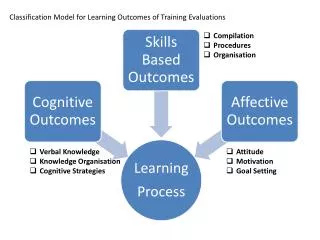
Image Source Page: http://www.nwlink.com/~donclark/learning/learningoutcomes.html
Strengthening the Arkansas Education Pipeline • Improving Preparation • Decreasing Remediation • Accessing Financial Aid • Increasing Retention and Graduation • Enhancing Funding and Governance • Addressing Data Needs • Supporting Economic Development • Issues for Further Study
No state with a low proportion of Bachelor’s degrees has a high per capita income. No state with a high proportion of Bachelor’s degrees has a low per capita income. State Per Capita Personal Income v. Share of Adult Population with Bachelor's Degree or Higher (2008) 2002= 19.7% DC CT NJ MD MA VA 2008= 18.8% NY NH DE RI MN CA AK IL CO WA VT NV WI FL WY MI PA HI ME GA IA OR KS MO AZ IN OH NC NE ND TN TX MT AL SD SC UT KY NM OK AR LA ID WV MS 2008 2007 2006 2005 2002
Fall 2000 College Freshmen Percent 96-97 Arkansas 9th Grader’s Progression into High School and College (percent) 100% 71% 28%
Fall 2000 College Freshmen 96-97 Arkansas 9th Grader’s Progression into High School and College (number) 100% 71% 28%
Reading Remediation Rates by CountyFall 2007 % Needing Remediation First-time entering (full- and part-time) students seeking an associate or baccalaureate degree.
English Remediation Rates by CountyFall 2007 % Needing Remediation First-time entering (full- and part-time) students seeking an associate or baccalaureate degree.
Math Remediation Rates by CountyFall 2007 % Needing Remediation First-time entering (full- and part-time) students seeking an associate or baccalaureate degree.
Unduplicated Remediation Rates by CountyFall 2007 % Needing Remediation First-time entering (full- and part-time) students seeking an associate or baccalaureate degree.
A student who has to take remediation graduates at less than half the rate of students who come to college with the requisite skills.
A student who has to take remediation graduates at less than half the rate of students who come to college with the requisite skills.
Cost of Remediation $53,800,000 Equivalent to the combined budget of seven of Arkansas’s community colleges. 2007-08 - $65.7 million with $24 million (36%) of those expenditures subsidized by state general revenues.
2005 Loan Default Rates 2.3% (VT) 2.6% 7.2% 6.9% 2.2% (DC) 7.1% 6.8% (5th) 6.9% 2.0% Source: U.S. Department of Education
2006 Loan Default Rates 2.4% 2.4% 2.4% (VT) 2.3% 7.4% 8.8% 9.7% 9.3% 7.6% (4th) Source: U.S. Department of Education
2007 Loan Default Rates 2.3% 3.1% 2.8% 9.3% 9.8% 9.0% (4th) 9.3% 8.8% Source: U.S. Department of Education
HB 1990/ Act 971 AN ACT TO REQUIRE CLEAR EXIT STANDARDS FOR ALL REMEDIAL COURSES TAKEN AT STATE-SUPPORTED INSTITUTIONS OF HIGHER EDUCATION; TO IMPROVE THE TEACHING TECHNIQUES OF REMEDIAL COURSES; AND FOR OTHER PURPOSES. Representatives: J. Roebuck, D. Hutchinson, M. Burris, Carnine, Clemmer, Cole, Nickels, Saunders, G. Smith, Stewart, Abernathy Senators : G. Baker, Madison
The board, in collaboration with state-supported institutions of higher education, shall develop by institution uniformmeasurable exit standards for remedial courses that are comparable to the ACT or SAT equivalent required for college-level enrollment in credit courses to be implemented no later than the fall semester of 2010.
com·pa·ra·ble: • able to be likened to another; similar. • of equivalent quality; worthy of comparison ADHE preference: Nationally normed test that has been correlated to the ACT. Yell County
Other aspects of the Act 971 • The board shall work with state-supported institutions of higher education to: • (A) Develop innovative alternatives to traditional instruction and delivery methods for remedial courses; and • (B) Provide professional development opportunities to help remedial education faculty gain knowledge in best practices and trends in the instruction and delivery of remedial education. • ADHE efforts so far • Met with developmental education faculty organization • Dean Association • Chief Academic Officers/Presidents • AHECB • Trustees • Several individual faculty • Professional development • 3 best practices in assessment between Nov 09 and May 10 -- Student success conference – with special presentations on developmental students -- January 12 –Achieving the Dream on redesigning the curriculum • Support for this approach from AATYC, ASU system and UA system
The memo highlights • a significant change in its implementation. • students should not be barred from enrolling in college-level courses based on their developmental course post-test score for Fall 2010. • all students enrolled in developmental courses that immediately lead to college-level courses must be tested in Fall 2010 using an examination comparable to the ACT. • Students that do not attain a score comparable to an ACT of 19 will not be required by ADHE to undergo further developmental instruction—that decision will be at the discretion of the institution awarding the developmental course credit.
Ozark College 71.4% Math • Henderson State University: 62.8% overall 51.1 in Math and 68.1% in English • Lowest: 18.2 overall • Several Maths in the teens
Future Efforts • Quantify student gains • Compare the success of students who were passed on with and without passing exit assessment • Targeted remediation: • Greater use of diagnostics • Develop small modular instructional vignettes • Individualized instruction • Supplemental instruction for students on the margin in credit bearing course based upon assessment/motivation • Require an Ability to Benefit assessment for students who score very low on the remediation metric – limit course taking options until college ready