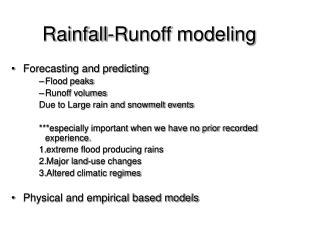
Overview of PRMS Snow Modeling System for Precipitation Runoff
660 likes | 735 Views
Learn about the PRMS Snow Modeling System, including energy balance formulations, snowpack dynamics, temperature adjustments, and precipitation distribution methods. Explore PRMS parameters, snow properties, and modeling applications.

Overview of PRMS Snow Modeling System for Precipitation Runoff
E N D
Presentation Transcript
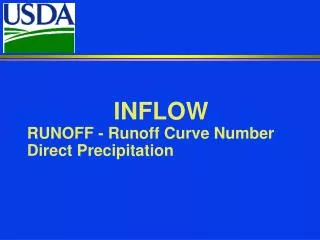
PRECIPITATION-RUNOFF MODELING SYSTEM(PRMS) SNOW MODELING OVERVIEW
PRMSParameters MMS Version
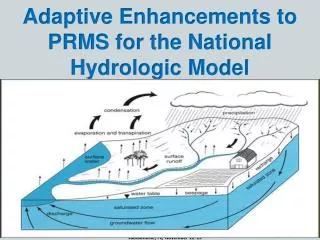
SNOW PROPERTIES • Porous media • Undergoes metamorphosis • Surface albedo changes with time • Density increases with time • Has a free-water holding capacity
Energy Balance Formulation Hm = Hsn + Hln + Hc + He + Hg + Hp + Hq Temperature-Index Formulation M = Cm * ( Ta - Tb) Modifications Seasonal adjustment to Cm Vary Cm for forest and open Use equation only for non rain days Account for Hg and Hq
PRMS SNOW MODEL Energy Balance Formulation Hm = Hsn + Hln + Hc + He + Hg + Hp + Hq Model Formulation (on each HRU) Hsn = swrad * (1. - albedo) * rad_trncf Hln = emis * sb_const * tavg4 (es T4) Hc + He = cecn_coef(mo) * tavg (ppt days) = 0 (dry days) Hp = tavg * net_precip Hg assumed 0 Hq is computed
Net Longwave Radiation Hlw = (1. - covden_win) * [(emis * air) -snow)] + covden_win * (air -snow) air and snow = sb_const * tavg4 [ (es T4) e = 1.] where tavg is temp of air and temp of snow surface emis = emis_noppt no precip = 1.0 precip
PRMS SNOW MODEL Energy Balance Formulation Hm = Hsn + Hln + Hc + He + Hg + Hp + Hq Model Formulation Hsn = SWRin * (1. - ALBEDO) * TRNCF Hln = es T4 Hc + He = Cce * Tavg (ppt days) = 0 (dry days) Hp = Tavg * PTN Hg assumed 0 Hq is computed
SNOWPACK DYNAMICS • 2-layered system • energy balance: 2 12-hour periods • energy exchange between layers -- conduction and mass transfer • Tsurface = min(tavg or 0o C) • Tpack is computed • density = f(time, settlement constant) • albedo decay = f(time, melt) • melt volume: use depth-area depletion curve
MELT SEQUENCE cal_net > 0 snowmelt = cal_net / 203.2 pk_temp < 0o C refreeze to satisfy pk_def pk_temp = 0o C satisfy free water holding capacity(freeh2o_cap) remaining snowmelt reaches the soil surface
TEMPERATURE For each HRU tmax(hru) = obs_tmax(hru_tsta) - tcrx(mo) tmin(hru) = obs_tmin(hru_tsta) - tcrx(mo) where tcrx(mo) = [ tmax_lapse(mo) * elfac(hru)] - -------------tmax_adj(hru) elfac(hru) = [hru_elev - tsta_elev(hru_tsta)] / 1000.
Mean Daily Precipitation Schofield Pass (10,700 ft) vs Crested Butte (9031 ft) Mean daily precip, in. MONTH
Precipitation Gage Catch Error vs Wind Speed (Larsen and Peck, 1972) Rain (shield makes little difference) Snow (shielded) Snow (unshielded)
Precipitation Gauge Intercomparison Rabbit Ears Pass, Colorado
PRECIPITATION For each HRU - DEPTH hru_precip(hru) = precip(hru_psta) * pcor(mo) pcor(mo) = Rain_correction or Snow_correction
PCORComputation Precipitation Distribution Methods(module) • Manual (precip_prms.f) • Auto Elevation Lapse Rate (precip_laps_prms.f) • XYZ (xyz_dist.f)
PCORComputation hru_plaps • Auto Elevation Lapse Rate For each HRU hru_psta hru_psta = precip station used to compute hru_precip [ hru_precip = precip(hru_psta) * pcor] hru_plaps = precip station used with hru_psta to compute ------ -------preciplapse rate by month [pmo_rate(mo)]
PCORComputation Auto Elevation Lapse Rate Parameters pmn_mo elv_plaps padj_sn or padj_rn
PCORComputation pmn_mo(hru_plaps) - pmn_mo(hru_psta) pmo_rate(mo) = elv_plaps(hru_plaps)-elv_plaps(hru_psta) For each HRU • Auto Elevation Lapse Rate hru_elev - elv_plaps(hru_psta) adj_p = pmo_rate * pmn_mo(hru_psta) snow_adj(mo) = 1. + (padj_sn(mo) * adj_p) if padj_sn(mo) < 0. then snow_adj(mo) = - padj_sn(mo)
PRECIPITATION For each HRU - FORM (rain, snow, mixture of both) RAIN tmin(hru) > tmax_allsnow tmax(hru) > tmax_allrain(mo) SNOW tmax(hru) <= tmax_allsnow
PRECIPITATION For each HRU - FORM (rain, snow, mixture of both) MIXTURE prmx = [(tmax(hru) - tmax_allsnow) / -------------------------(tmax(hru) - tmin(hru)] * adjmix_rain(mo) OTHER Precipitation Form Variable Snowpack Adjustment
PRMS Parameters Estimated • 9 topographic (slope, aspect, area, x,y,z, …) • 3 soils (texture, water holding capacity) • 8 vegetation (type, density, seasonal interception, radiation transmission) • 2 evapotranspiration • 5 indices to spatial relations among HRUs, gw and subsurface reservoirs, channel reaches, and point measurement stations
BASIN DELINEATION AND CHARACTERIZATION Polygon Hydrologic Response Units (HRUs) (based on slope, aspect, elevation, vegetation) Grid Cell Hydrologic Response Units (HRUs) (Equal to Image Grid Mesh) Focus of research modeling Focus of operational modeling
SUBSURFACE SURFACE GW ANIMAS RIVER, CO PREDICTED MEASURED
EAST FORK CARSON RIVER, CA SURFACE SUBSURFACE GW
CLE ELUM RIVER, WA SUBSURFACE SURFACE GW
REMOTELY SENSED SNOW-COVERED AREA AND SNOWPACK WATER EQUIVALENT
NASA Regional Earth Science Applications Center Objective - Integrate remotely sensed data into operational resource management applications SW Center - U of AZ, U of CO, USGS, --------------Lawrence Berkeley Labs ~ 1 km pixel resolution of NOAA snow-covered area product on 750 km2 basin
East Fork Carson River, CA 1986 1988 1986