
MRS% =
60. 60. 50. 50. Perceived PL (cm). Perceived WL (cm). WL. 40. 40. *. one hand. two hands. hand + knee. hand + axle. stick + axle. | LP i – L |) reps L. F. (. o r. (LP – L) 2 L. . 30. 30. H. Left. None. Left. None. Right. Right. x 100. AD% =. MRS% =. x 100.

MRS% =
E N D
Presentation Transcript
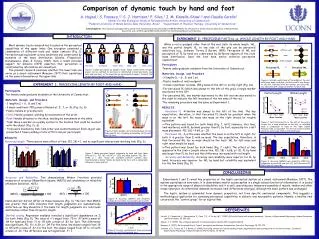
60 60 50 50 Perceived PL (cm) Perceived WL (cm) WL 40 40 * one hand two hands hand + knee hand + axle stick + axle |LPi – L|) reps L F ( o r (LP – L) 2 L 30 30 H Left None Left None Right Right x 100 AD% = MRS% = x 100 n.s. Mass Location Mass Location objects repetitions hand foot F H MRS% AD% a Hand Foot .375L to Left none .375L to Right b Perceived WL Perceived PL Figure 6. (a) Limb contact was at the middle of the rod with three mass conditions. (b) Perceived PL was always to the left, indicated with one marker; perceived WL was indicated with a separate marker for each end. Figure 1. Length perception by dynamic touch. Tissue contact with a target object can be confined to one hand or distributed across two hands, one hand and one knee, or the hand and an environmental support. Indeed, the target object need not be contacted directly. a b Partial Length Whole Length .9L .7L .5L c d Figure 7. (left) Perceived PL to the left of the grip is largest for a mass attached on the left; no attached mass is comparable to mass on the right. (right) Perceived WL is equivalent for the two mass locations which are both larger than no attached mass. Figure 2. Rods, handles, and attached masses for (a) hand and (b) foot. Grasping and wielding by (c) hand and (d) foot. * F H 1.0 1.0 * Hand Foot .8 .8 F H .6 .6 Perceived Length (m) Perceived Length (m) .4 .4 L (m) L (m) .6 .6 .2 .2 .8 .8 1.0 1.0 0 0 .5 .7 .9 .5 .7 .9 Mass/L n.s. F 30 H n.s. % error 20 F 10 H 0 MRS% AD% Figure 4. Accuracy (MRS%) and reliability (AD%) did not differ for hand (H) and foot (F). -.1 -.2 Log Lp HAND -.3 FOOT -.4 -1.4 -1.2 -1 -.8 -.6 Log I1 Figure 5. Log-log regressions of mean perceived length (Lp) on I1 for hand and foot Comparison of dynamic touch by hand and foot • A. Hajnal,1 S. Fonseca,1,2 S. J. Harrison,1 P. Silva,1 J. M. Kinsella-Shaw1,3 and Claudia Carello1 • 1Center for the Ecological Study of Perception and Action, University of Connecticut • 2Federal University of Minas Gerais, Belo Horizonte, Brazil3Department of Physical Therapy, University of Connecticut • Acknowledgments. This research was supported by grants from the National Science Foundation (SBR 00-04097), the University of Connecticut (Co-laboratory of Rehabilitation Research), and a CAPES Award (BEX 0320-05-06) from the Brazilian Ministry of Education. INTRODUCTION EXPERIMENT 2: PERCEIVING PARTIAL vs. WHOLE LENGTH BY FOOT AND HAND When a rod is grasped other than at the end, both its whole length, WL, and the partial length, PL, to one side of the grip can be perceived selectively (e.g., Solomon, Turvey & Burton, 1989). Perception of WL and perception of PL by hand are constrained by different aspects of the rod’s mass distribution. Does the foot have similar selective perception capabilities? Most dynamic touch research has focused on the perceptual capabilities of the upper limbs. One exception examined a combination of different tools and tissue contacts (Fig. 1). Perception was equivalent across conditions and constrained by moments of the mass distribution (Carello, Fitzpatrick, Domaniewicz, Chan, & Turvey, 1992). Such a result provides support for Gibson’s (1979) assertion that perception is constrained by information not sensations. The present research examines whether the lower limb can serve as a smart instrument (Runeson, 1977) that capitalizes on the same information as the upper limb. • Participants • Twenty undergraduate students from the University of Connecticut. • Materials, Design, and Procedure • 3 lengths (L = .6, .8, and 1 m) • Plastic handle at rod’s midpoint • 3 mass conditions: no mass, 150 g mass on the left or on the right (Fig. 6a) • For perceived PL (which was always to the left of the grip), a single marker was moved to the left. • For perceived WL, one marker was moved to the left and one was moved to the right to indicate the felt locations of the two ends of the rod. • The remaining procedure was the same as Experiment 1. • RESULTS • Perceived PL. Attention was always to the left of the limb. The key expectation, therefore, is that Perceived PL should be greatest when the mass is on the left. No mass and mass on the right should be roughly equivalent. • This pattern was found for both limbs (Fig. 7, left). However, this time, limb mattered, with PL by hand greater than PL by foot, especially for a left mass placement, F(2, 18) = 4.68, p < .02. • Perceived WL.I1 is the same whether the mass is on the left or right; for both it is greater than I1 with no mass. The key expectation, therefore, is that Perceived WL for no mass should be the least; WL for left mass and right mass should be equal. • This pattern was found for both limbs (Fig. 7, right). The effect of limb appeared in the Limb x Length interaction, F(2, 18) = 6.68, p < .01. PL by hand was larger than PL by foot and this difference increased with rod length. • Accuracy and Reliability. Accuracy and reliability were superior for PL by hand. Accuracy was superior for WL by hand but reliability was equivalent for the two limbs (Fig. 8). EXPERIMENT 1: PERCEIVING LENGTH BY FOOT AND HAND • Participants: • Ten female undergraduate students at the University of Connecticut. • Materials, Design, and Procedure • 3 lengths (L = .6, .8, and 1 m) • 3 mass conditions: 150 g mass attached at .5, .7, or .9L (Fig. 2a, b) • Plastic handle at proximal end • Hand: Handle grasped; wielding by movements at the wrist • Foot: Handle attached to the shoe; wielding by movements at the ankle • Task: Move a marker on a pulley system to the location that could be reached with the object (Fig. 2c, d). • Trials were blocked by limb; limb order was counterbalanced. Each object was presented 3 times yielding a total of 54 trials per participant. PL RESULTS Perceived length.There was no main effect of limb, F(2, 18) ≈ 1, and no significant interactions involving limb (Fig. 3). 50 % error 25 Figure 3. Mean perceived length judgments by hand and foot. Main effects of L, F(2, 18) = 95.74, p < .001, and mass position, F(2, 18) = 39.53, p < .001, reveal the standard pattern: Lengths were discriminated in similar fashion by hand and by foot, with a comparable influence of mass position 0 MRS% AD% Figure 8. Accuracy (MRS%) and reliability (AD%) for judgments by hand (H) and foot (F). (left) Perceived PL and (right) Perceived WL. Mass/L CONCLUSIONS Accuracy and Reliability. Two dimensionless Weber fractions provided measures of accuracy (Mean Root-Square, MRS%) and consistency or reliability (Absolute Deviation, AD%): Experiments 1 and 2 reveal key properties of the haptic perceptual system as a smart instrument (Runeson, 1977). The system capitalizes on invariants; it is determinate insofar as perception is a single-valued function of information; it is scaled in the appropriate range of physical stimulation; and it is soft, operating as a temporary assembly of muscle, tendon and other tissue synergies. As attentional demands increased, limb differences emerged, although the basic pattern was unchanged. The haptic system is assembled from dynamic properties, not from specific anatomical components. This suggests a methodological application for assessing perceptual capabilities in diabetic and neuropathic patients. Namely, a healthy limb can provide the “control group” for an injured limb. Hand and foot did not differ on these measures (Fig. 4).The fact that MRS% was greater than AD% indicates that length judgments are systematically distorted—as they should be if the basis for length judgments is a rod’s mass distribution rather than its metric length. Inertial scaling.Regression analyses revealed a significant dependence on I1 for both limbs (Fig. 5). The value of r2 ranged from .75 to .97 with a mean of .89 for hand and from .71 to .92 with a mean of .83 for foot. This difference was significant, F(1, 9) = 6.39, p < .04. For the hand, the slopes ranged from .16 to .55 with a mean of .37; for the foot, the slopes ranged from .07 to .67 with a mean of .32. This difference was not significant, F < 1. REFERENCES Carello, C., Fitzpatrick, P., Domaniewicz, I., Chan, T-C., & Turvey, M. T. (1992). Effortful touch with minimal movement. Journal of Experimental Psychology: Human Perception and Performance, 18, 290-302. Gibson, J. J. (1979). The ecological approach to visual perception. Boston, MA: Houghton Mifflin. Runeson, S. (1977). On the possibility of “smart” perceptual mechanisms. Scandinavian Journal of Psychology, 18, 172-179. Solomon, H. Y., Turvey, M. T. & Burton, G. (1989). Perceiving extents of rods by wielding: Haptic diagonalization and decomposition of the inertia tensor. Journal of Experimental Psychology: Human Perception & Performance, 15, 58-68.