Download
1 / 15
160 likes | 343 Views
Application of a small area estimation method to make better use of existing data in Bangladesh. Nobuo Yoshida April 20, 2011. Demand for more frequent and disaggregated poverty data is rising.

E N D
Application of a small area estimation method to make better use of existing data in Bangladesh Nobuo Yoshida April 20, 2011
Demand for more frequent and disaggregated poverty data is rising • In many developing countries, including LICs, demand for more frequent and disaggregated poverty estimates is rising • More countries produce poverty estimates at the sub-national levels • Also, many countries try to produce poverty data more frequently
To produce more frequent and disaggregated poverty data (i) • A more direct approach is to • Increase frequency of household surveys • Increase the sample size • Pro • Estimation method is straightforward • Cons • Costly • Increasing non-sampling error
To produce more frequent and disaggregated poverty data (ii) • Apply a small area estimation method developed by Elbers, Lanjouw and Lanjouw (ELL) (2003) • Pros • Cheap • Decreasing the non-sampling error • Cons • Fairly complex method • Increasing error in execution of the method
What is the ELL method? • Two main features • Impute consumption in CENSUS/CWIQ without it • Imputation models are estimates in a large multi-topic survey including both consumption and other indicators
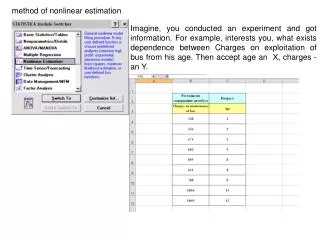
What is CWIQ? • CWIQ (Core Welfare Indicators Questionnaire) survey • Invented to collect data for producing simple indicators • Intended to use it for quick data collection and collect a large sample • Consumption or income is not recommended to be included • Useful to monitor simple inputs, process and output indicators • CWIQ is similar to Census in the following senses: • Questionnaire must be simple • Sample size is large • No complex welfare indicator like consumption or income
How does ELL work? Census/CWIQ LSMS X C X Ĉ=F(X) Develop imputation model Regress C on X C: Consumption X: Other indicators like employment, educationĈ=F(X): Imputed (or predicted) Consumption C=F(X)
Pros and Cons • Data without consumption is cheap and easy to collect • It is easy to increase the sample size and frequency • Census is collected anyway (zero additional cost) • Implementing CWIQ is much cheaper than LSMS • But, new errors “imputation error” • Need to make efforts to find good imputation models
Application to poverty estimation at the village level Village A Ĉ Ĉ Ĉ Ĉ C Ĉ Ĉ Ĉ Ĉ C Ĉ Ĉ Ĉ Ĉ Ĉ Ĉ Ĉ Ĉ Ĉ Ĉ Ĉ Ĉ C Ĉ HHLD selected by LSMS (3 hhlds) HHLD not selected by LSMS, but in Census (21 hhlds) C Ĉ
Application to increase frequency t0 t0+1 t0+3 t0+4 t0+5 t0+2 t0+6 Ĉ Ĉ Ĉ Ĉ Ĉ f1(x) f2(x) C C C LSMS (create imputation models) Ĉ CWIQ (no consumption)
Challenges to apply ELL to increase frequency CRISIS Ĉ Ĉ Ĉ Ĉ Ĉ f1(x) f1(x) f1(x)?? C C f2(x) Can we use the same imputation model even after a crisis hits a country? Literature suggests it is not always the case…
A possible solution • Collect consumption data from a small sub-sample of CWIQ surveys • Use them to recreate imputation models for each year CWIQ Ĉ=F(X) C, X C=Ft(X) Year=t Trade-off: the smaller the sub-sample, the cheaper but the less accurate.
Bangladesh • Bangladesh Bureau of Statistics (BBS) used ELL to estimate poverty at the sub-district level • BBS is now planning to use ELL to increase frequency • DEC & PRMPR are jointly studying the effectiveness of the subsample approach
For more information • Contact persons • Peter Lanjouw (DECPI) • Nobuo Yoshida; ChekuDorji; MeeraMahadehan (all PRMPR) • AnanyaBasu; Faizuddin Ahmed (SASEP) • Software • POVMAP – Software to run the ELL method (http://intranet.worldbank.org/servlet/main?theSitePK=477228&contentMDK=22717057&menuPK=546145&pagePK=64168149&piPK=64168042) • Future events • Dissemination of results in Dhaka, Bangladesh (September, 2011) • Second workshop for high frequency poverty data (October, 2011)
Brief literature list • Christiaensen, L.; P. Lanjouw; J. Luoto and D. Stifel (2010). “The Reliability of Small Area Estimation Prediction Methods to Track Poverty,” Mimeo, Development Research Group, the World Bank, Washington D.C. • Examine how well the ELL method works for increasing frequency of poverty data • Elbers, C., J.O. Lanjouw, and P. Lanjouw (2003). “Micro-level Estimation of Poverty and Inequality,” Econometrica, 71(1):355-364. • Explain the ELL method in detail • Bangladesh Poverty Mapping report, available upon request • An application of the ELL method for disaggregating poverty data in Bangladesh • Concept Note for High frequency poverty data, available upon request • Explain how the ELL method will be used for increasing frequency of poverty data in Bangladesh • Manual for POVMAP2 – available in POVMAP website