Download
1 / 11
110 likes | 115 Views
This study investigates the correlation between coral species and different benthic cover types in the He'eia region of Hawaii. The dataset includes samples of four coral species and four benthic cover types, and analysis was performed using outlier analysis, data screening, scatterplot patterns, and PCA.

E N D
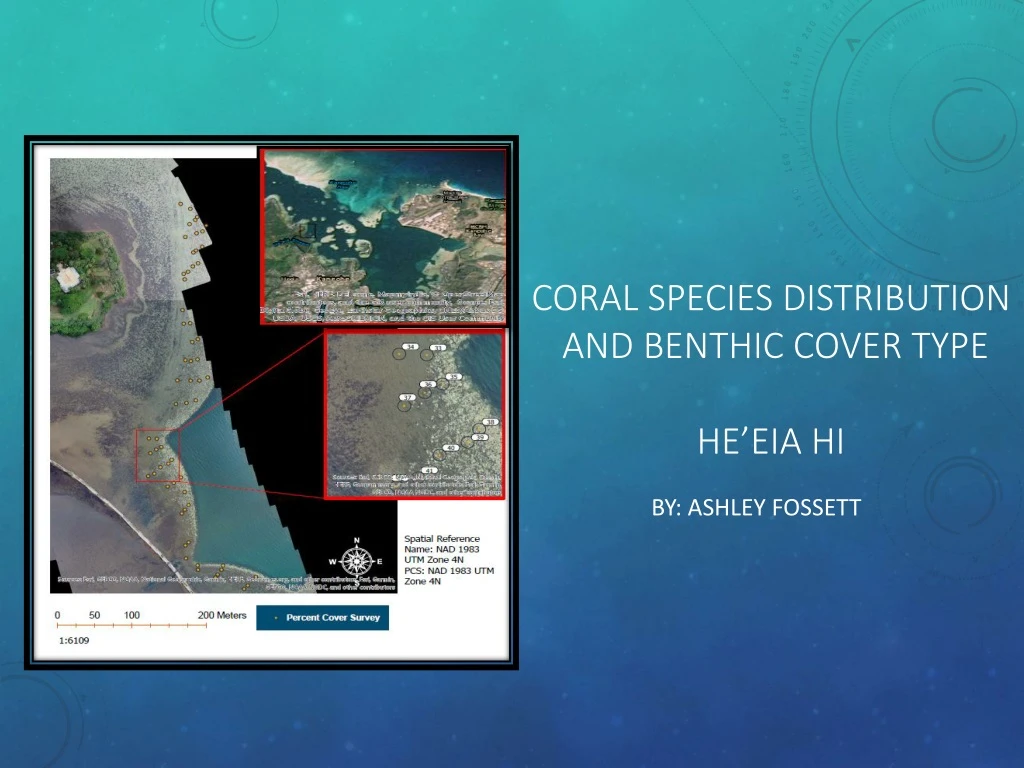
Coral Species distribution and Benthic Cover typeHe’eia HI By: Ashley Fossett
How are coral species correlated with different benthic cover types? Reef building corals Montipora capitata Porites compressa Resilient / Successional corals Leptastrea purpurea Pocillopora damicornis Ho: There is no pattern between coral species and benthic cover type Ha: There is a significant pattern between coral species and benthic cover type
Dataset Description Main Matrix • 60 samples and 4 species • Samples were taken along a varying gradient of coral cover • 4 species identified: • %MC Montipora capitata • %PC Porites compressa • %PD Pocillopora damicornis • %LP Leptastrea purpurea Second Matrix • 60 samples and 4 Benthic cover types • 4 types of Benthic cover: • TCC Total Coral Cover • Hsub Hard Substrate • Rubble Dead Coral/ Rock Piece • Sand/Silt Bare ground
Data Processing Main Matrix: Species Row Summary: Average Skewness: 1.624 240 cells in main matrix Percent of cells empty = 18.750 Matrix total = 0.59997E+02 Matrix mean = 0.24999E+00 • 2nd Matrix data: Benthic Cover • Row Summary: • Average Skewness:1.152 • 240 cells in main matrix • Percent of cells empty = 10.833 • Matrix total = 0.60002E+04 • Matrix mean = 0.25001E+02 Outlier Analysis : Same for 1st and 2nd matrix No samples were recognized as outliers given cutoff of 2.0 standard deviations from the grand mean.
Screening #2 – Data Summary • I do not have outliers in my data but I do have a lot of zeros. • I am tying to assume a normal distribution of my species therefore I performed a general relativization and an arcsine transformation. • I used an arcsine transformation because I am dealing with percent cover data that range from 0-1 with 1 being 100% of the coral in a survey. Main Matrix: Species Row Summary: Average Skewness: 1.624 240 cells in main matrix Percent of cells empty = 18.750 Matrix total = 0.59997E+02 Matrix mean = 0.24999E+00 Main Matrix: Species Row Summary: Average Skewness: 1.234 240 cells in main matrix Percent of cells empty = 18.750 Matrix total = 0.25585E+01 Matrix mean = 0.10661E-01
Scatterplot Patterns • Due to the fact that coral compete for space and the data are comparing percent coral cover, by design PC and MC are negatively correlated. • If there is more PC this takes up space for MC • However, based on these species making up total coral cover it turns out that MC is negatively correlated with TCC while PC is positively correlated with TCC • Whereas the opposite is true for sand/silt substrate
Results Interpretation correlation matrix (Main) Pearson and Kendall Correlations with Ordination Axes N= 60 Axis: 1 2 3 r r-sq tau r r-sq tau r r-sq tau % MC -.976 .953 -.890 .211 .044 .355 -.018 .000 -.198 % PC .977 .955 .945 .206 .042 -.185 -.017 .000 .144 % PD -.124 .015 -.108 -.803 .644 -.080 .530 .281 .583 % LP -.027 .001 -.116 -.966 .934 -.279 -.224 .050 -.223 correlation matrix (second) Pearson and Kendall Correlations with Ordination Axes N= 60 Axis: 1 2 3 r r-sq tau r r-sq tau r r-sq tau TCC .598 .357 .513 .337 .114 .039 .099 .010 .102 HSub .065 .004 -.165 -.148 .022 .025 .002 .000 .066 Rubble -.034 .001 .005 -.689 .475 -.318 -.381 .145 -.068 Sand -.723 .522 -.592 -.174 .030 .093 -.037 .001 -.081
Results Interpretation It looks like my data is only correlated with Axis 1. Coefficients of determination for the correlations between ordination distances and distances in the original n-dimensional space: R Squared Axis Increment Cumulative 1 .897 .897 2 .102 .999 3 .000 1.000 Increment and cumulative R-squared were adjusted for any lack of orthogonality of axes. Axis pair r Orthogonality,% = 100(1-r^2) 1 vs 2 0.000 100.0 1 vs 3 0.000 100.0 2 vs 3 0.000 100.0 Number of entities = 60 Number of entity pairs used in correlation = 1770 Distance measure for ORIGINAL distance: Euclidean (Pythagorean)
Discussion • These results indicate a positive relationship between my species distribution and benthic cover type • Specifically a difference between the two major reef building coral species • This multivariate approach described an underlying hypotheses that Montipora capitata are better at dealing with higher levels of sedimentation and a more turbid habitat compared to Porites compressa.
Next Steps • I would like to further this investigation and establish a Weighted Average between species and run the analysis again. • With this knowledge that MC is more associated with a sandy substrate I hope to identify more patterns between the more resilient coral species. Resilient / Successional corals Leptastrea purpurea Pocillopora damicornis