Download
1 / 38
390 likes | 475 Views
Explore the major cardiovascular functions during exercise, focusing on delivery, removal, transportation, maintenance, and prevention. Learn about the heart, coronary circulation, cardiac arrhythmias, stroke volume, cardiac output, blood pressure, and the cardiovascular response to acute exercise. Discover how heart rate and intensity are influenced by training, with insights on resting heart rate and heart rate recovery.

E N D
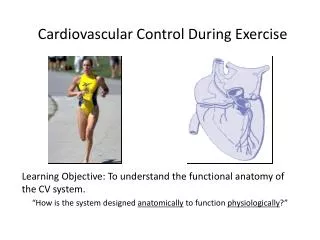
Major Cardiovascular Functions w Delivery (e.g., oxygen and nutrients) w Removal (e.g., carbon dioxide and waste products) w Transportation (e.g., hormones) w Maintenance (e.g., body temperature, pH) w Prevention (e.g., infection—immune function)
Cardiovascular System w A pump (the heart) w A system of channels (the blood vessels) w A fluid medium (blood)
Key Points Structure and Function of the Cardiovascular System w The two atria receive blood into the heart; the two ventricles send blood from the heart to the rest of the body. w The left ventricle has a thicker myocardium due to hypertrophy resulting from the resistance against which it must contract.
Did You Know…? Resting heart rates in adults tend to be between 60 and 85 beats/min. However, extended endurance training can lower resting heart rate to 35 beats/min or less. This lower heart rate is thought to be due to decreased intrinsic heart rate and increased parasympathetic stimulation.
Cardiac Arrhythmias Bradycardia—resting heart rate below 60 beats/min Tachycardia—resting heart rate above 100 beats/min Premature ventricular contractions (PVCs)—feel like skipped or extra beats Ventricular tachycardia—three or more consecutive PVCs that can lead to ventricular fibrillation in which contraction of the ventricular tissue is uncoordinated
Cardiac Cycle w Events that occur between two consecutive heartbeats (systole to systole) w Diastole—relaxation phase during which the chambers fill with blood - 62% of cycle duration w Systole—contraction phase during which the chambers expel blood - 38% of cycle duration
Stroke Volume (SV) w Volume of blood pumped per contraction w End-diastolic volume (EDV)—volume of blood in ventricle before contraction w End-systolic volume (ESV)—volume of blood in ventricle after contraction w SV = EDV – ESV . Cardiac Output (Q) w Total volume of blood pumped by the ventricle per minute . w Q = HR ´ SV Stroke Volume and Cardiac Output
Blood Pressure w Systolic blood pressure (SBP) is the highest pressure and diastolic blood pressure (DBP) is the lowest pressure w Mean arterial pressure (MAP)—average pressure exerted by the blood as it travels through arteries w MAP = DBP + [0.333 ´ (SBP – DBP)] wRest Blood Pressure is about 120/80 wHypertension: BP = more than 140/90 wHypotension: BP = less than 90/60
Parameters Affected by Training w Heart size w Stroke volume w Heart rate w Cardiac output w Blood flow w Blood pressure w Blood volume
. • Stroke volume (SV) increases up to 40% to 60% VO2max in untrained individuals and up to maximal levels in trained individuals. • Increases in HR and SV during exercise cause cardiac output (Q) to increase. . Cardiovascular Response to Acute Exercise • Heart rate (HR) increases as exercise intensity increases up to maximal heart rate. w Blood flow and blood pressure change. w All result in allowing the body to efficiently meet the increased demands placed on it.
Resting Heart Rate w Averages 60 to 80 beats/min; can range from 28 to above 100 beats/min w Tends to decrease with age and with increased cardiovascular fitness w Is affected by environmental conditions such as altitude and temperature
Maximum Heart Rate w The highest heart rate value one can achieve in an all-out effort to the point of exhaustion w Remains constant day to day and changes slightly from year to year • Can be estimated: HRmax = 220 – age in years or HRmax = 208 – (0.7 age)
Resting Heart Rate w Decreases with endurance training likely due to more blood returning to heart and changes in autonomic control w Sedentary individuals can decrease RHR by 1 beat/min per week during initial training, but several recent studies have shown small changes of less than 3 beats/min with up to 20 wk of training w Highly trained endurance athletes may have resting heart rates of 30 to 40 beats/min
Submaximal w Decreases proportionately with the amount of training completed w May decrease by 10 to 30 beats/min after 6 months of moderate training at any given rate of work, with the decrease being greater at higher rates of work Maximal w Remains unchanged or decreases slightly w A decrease might allow for optimal stroke volume to maximize cardiac output Heart Rate During Exercise
Heart Rate Recovery Period w The time after exercise that it takes your heart to return to its resting rate w With training, heart rate returns to resting level more quickly after exercise w Has been used as an index of cardiorespiratory fitness w Conditions such as altitude or heat can affect it w Should not be used to compare individuals to one another
Stroke Volume w Determinant of cardiorespiratory endurance capacity at maximal rates of work w Increases with increasing rates of work up to intensities of 40% to 60% of max or higher w May continue to increase up through maximal exercise intensity, generally in highly trained athletes • Magnitude of changes in SV depends on position of body during exercise
Subjects SVrest (ml) SVmax (ml) Untrained 50-70 80-110 Trained 70-90 110-150 Highly trained 90-110 150-220 Stroke Volumes (SV) for Different States of Training
. CHANGES IN Q AND SV WITH INCREASING RATES OF WORK
w When exercise intensity exceeds 40% to 60%, further increases in Q are more a result of increases in HR than SV since SV tends to plateau at higher work rates. . Cardiac Output w Resting value is approximately 5.0 L/min. w Increases directly with increasing exercise intensity to maximal values of between 20 to 40 L/min. w The magnitude of increase varies with body size and endurance conditioning.
. CHANGES IN Q AND SV WITH INCREASING RATES OF WORK
. CHANGES IN HR, SV, AND Q WITH CHANGES IN POSITION AND EXERCISE INTENSITY
Cardiovascular Endurance Exercise w Systolic BP increases in direct proportion to increased exercise intensity w Diastolic BP changes little if any during endurance exercise, regardless of intensity Resistance Exercise w Exaggerates BP responses to as high as 480/350 mmHg Blood Pressure
Cardiovascular Adaptations to Training w Left ventricle size and wall thickness increase w Resting, submaximal, and maximal stroke volume increases w Maximal heart rate stays the same or decreases w Cardiac output is better distributed to active muscles and maximal cardiac output increases w Blood volume increases, as does red cell volume, but to a lesser extent w Resting blood pressure does not change or decreases slightly, while blood pressure during submaximal exercise decreases