Download
1 / 24
240 likes | 355 Views
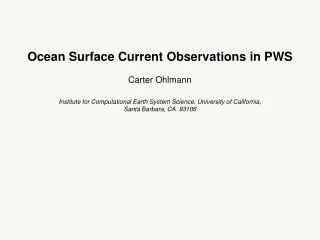
The California Current System from a Lagrangian Perspective Carter Ohlmann Institute for Computational Earth System Science, University of California, Santa Barbara, CA 93106 Collaborators: Luca Centurioni and Peter Niiler. 0 0.5 1. probability.

E N D
The California Current System from a Lagrangian Perspective Carter Ohlmann Institute for Computational Earth System Science, University of California, Santa Barbara, CA 93106 Collaborators: Luca Centurioni and Peter Niiler
0 0.5 1 probability how a physical oceanographer might address the problem crux: obtaining a large number of accurate trajectories
Outline: • tools to describe the ocean pathways - surface drifters for various scales - satellite altimetry - numerical models • summary of CCS drifter observations • CCS shown with combined data sets • comparison between data and OGCM results • how would ballast water move?
Goals: • present tools for observing the CCS circulation • indicate the CCS general circulation •demonstrate the importance of eddies •show the “inshore” region has different physics Message: • need to know pathways prior to designating ballast water dumping sites • tools and knowledge exist so this can be done with unprecedented accuracy
SVP drifter • spherical plastic float, 38 cm diameter • holey sock drogue (length ~ 5m) • SST (thermistor +- 0.1° C) • drogue on/off sensor (strain gauge, submergence) • ARGOS position (150 – 1000 m; 3 – 4 hrs) • drag area ratio ~ 40; slip = 1 - 2 cm s-1 • mean half life >400 days • Kriging of fixes (6 hour intervals) • Correction for wind slip • Recovery of “drogue off” data
Microstar drifter • tri-star drogue (length ~1m) •GPS position accurate to 10 m • position updates every 10 minutes • data transmitted via Mobitex™ digital, data-only, cellular network • near real-time data and thus recoverable • drag-area-ratio = 41.3 • slip 1 – 2 cm s-1 • 1 – 2 day deployment time
All approaches to determining trajectories have strengths and weaknesses • drifters - most accurate trajectories sampling bias •altimetry – excellent time and space coverage aliasing issues •models – models are models •HF radar – excellent time and space coverage range limitations An understanding of ballast water transport will come from a combination of approaches
cm s-1 mean EKE0.5 at 15 m depth from drifter observations
vector correlation and scatter plots of “geostrophic” velocity residuals from drifters and AVISO
unbiased geostrophic velocity at 15 m from drifters and altimetry
mean sea level (cm) from various ocean models HYCOM NLOM POP ROMS
HYCOM POP NLOM EKE0.5 from various ocean models (0-20 cm s-1) ROMS
EKE0.5 comparison with data (0-20 cm s-1) ROMS unbiased drifter data
Question: How would dumped ballast water be transported through the CCS? Answer: Don’t know exactly, yet; but know how to figure it out.•large quantities of trajectories are needed• connectivity matrices can be computed• many observational capabilities exist• combination of data sets is powerful
Key point summary: • a variety of observational techniques can be combined for leveraging (including models) • eddy energy is many times larger than the mean beyond the shelf break (altimetry + drifters) • shelf flow is neither in geostrophic nor Ekman balance; Lagrangian observations are lacking; need work here •new drifter technology and HF radar are available for observing shelf circulation • accurate pathways are not presently available, but the data and methods for determining them are