Download
1 / 147
1.69k likes | 2.2k Views
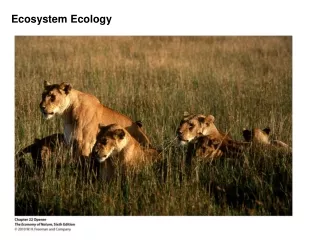
BIO-201 ECOLOGY. 3. Ecosystem Ecology - Energy Flux. H.J.B. Birks. Ecosystem Ecology - Energy Flux. Introduction Some definitions Global primary production Patterns of terrestrial primary production Patterns of aquatic primary production Role of consumers on rates of primary production

E N D
BIO-201 ECOLOGY 3. Ecosystem Ecology - Energy Flux H.J.B. Birks
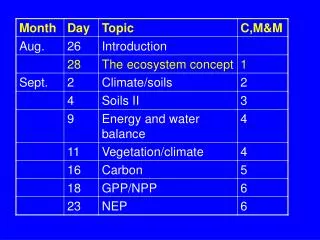
Ecosystem Ecology - Energy Flux Introduction Some definitions Global primary production Patterns of terrestrial primary production Patterns of aquatic primary production Role of consumers on rates of primary production Productivity – standing crop biomass relationships Trophic levels Interactions across ecosystems Conclusions and summary
Pensum The lecture, of course, and the PowerPoint handouts of this lecture on the BIO-201 Student Portal Also ‘Topics to Think About’ on the Student Portal filed under projects
Topics to Think About On the Bio-201 Student Portal filed under Projects, there are several topics to think about for each lecture. These topics are designed to help you check that you have understood the lecture and to identify important topics for discussion in the Bio-201 colloquia. In addition, there are two or three more demanding questions at the sort of level you can expect in the examination question based on my 10 lectures. These can also be discussed in the colloquia.
Background Information There is now a wealth of good or very good ecology textbooks but perhaps no excellent, complete, or perfect textbook of ecology. Not surprising, given just how diverse a subject ecology is in space and time and all their scales. This lecture draws on primary research sources, my own knowledge, experience, observations, and studies, and several textbooks.
Textbooks that provide useful background material for this lecture Begon, M. et al. (2006) Ecology. Blackwell (Chapter 17) Bush, M. (2003) Ecology of a Changing Planet. Prentice Hall (Chapter 5) Krebs, C.J. (2001) Ecology. Benjamin Cummings (Chapters 25, 26) Miller, G.T. (2004) Living in the Environment. Thomson (Chapters 3, 4) Molles, M.C. (2007) Ecology Concepts and Applications. McGraw-Hill (Chapter 18) Ricklefs, R.E. & Miller, G.L. (2000) Ecology. W.H. Freeman (Chapters 9, 10) Smith, R.L. & Smith, T.M. (2007) Ecology and Field Biology. Benjamin Cummings (Chapter 24) Townsend, C.R. et al. (2008) Essentials of Ecology. Blackwell (Chapter 11)
A Reminder If you try to read Begon, Townsend, and Harper (2006) Ecology – From Individuals to Ecosystems, there is a 17-page glossary of the very large (too large!) number of technical words used in the book on the Bio-201 Student Portal. It can be downloaded from the File Storage folder. Good luck!
Biosphere Biosphere Ecosystems Communities Populations Organisms Today’s Ecological Scale Biosphere Biomes ECOSYSTEMS & Landscapes Communities Species Populations Organisms
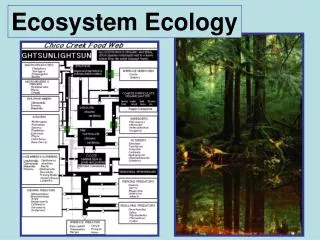
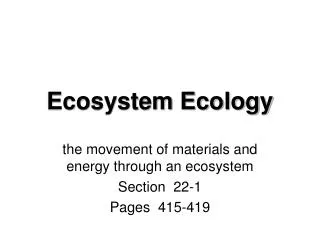
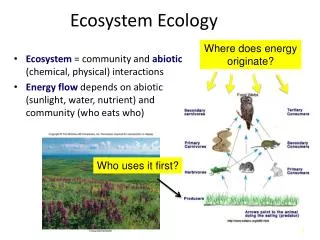
Introduction Consider ecosystems and associated communities as functional units Organisms and their environment are linked by energy flux, transformation of energy, and flux of matter (nutrients, etc.)
Solar radiation Energy in = Energy out Reflected by atmosphere (34%) Radiated by atmosphere as heat (66%) UV radiation Lower Stratosphere (ozone layer) Visible light Greenhouse effect Troposphere Absorbed by ozone Heat Absorbed by the earth Heat radiated by the earth Earth The source of energy for all life
Solar energy – some is reflected, some is converted to heat energy, some is absorbed by chlorophyll in plants. Infra-red radiation – absorbed by molecules in organisms, soil, and water, increasing their kinetic state, raising temperatures. Community temperature affects the rate of biochemical reactions and rate of water loss by transpiration from vegetation.
Biosphere Carbon cycle Phosphorus cycle Nitrogen cycle Water cycle Oxygen cycle Heat in the environment Heat Heat Heat Sustaining life on earth Water & sun + chlorophyll + minerals + CO2 Primary Production Gives oxygen to plants and animals Plants are the reason why Planet Earth is the only planet in the solar system with an oxygen-rich atmosphere
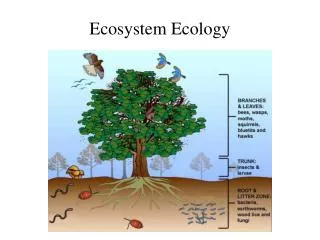
Plants use photosynthetically active radiation (PAR) to synthesize carbohydrate sugars. Some of this fixed energy is used to meet plant's energy needs. Some goes into plant growth. Some is stored as non-structural carbohydrates which act as energy sources in roots, seeds, and fruits. Photosynthesis increases plant biomass. Some of this fixed energy is consumed by herbivores, some by detritivores living on detritus, some ends up as soil organic matter. Energy fixed by plants powers animal motion, bird flight, etc. Plants are PRIMARY PRODUCERS (PHOTOAUTOTROPHS)
Vegetation is thus a system that absorbs, transforms, and stores solar energy. In this, physical, chemical, and biological structures and processes cannot be separated. Comprise ECOSYSTEM – a biological community (or several communities) plus all the abiotic factors influencing the community or communities.
Term ecosystem coined in 1935 by Arthur Tansley when he realised the importance of considering organisms and their environment as an integrated system. "Though the organisms may claim our primary interest … we cannot separate them from their special environment with which they form one physical system. It is the system so formed, the ecosystem, which, from the point of view of the ecologist, are the basic units of nature on the face of the earth" Tansley (1935) Sir Arthur Tansley
Ecosystem ecologists study the flows of energy, water, and nutrients in ecosystems. Physical and chemical processes as well as biological aspects. Primary production and energy flux – this lecture Nutrient cycling – Lecture 4 on ‘Ecosystem Ecology –Flux of Matter’
Ecosystem is, in some ways, an unsatisfactory term. System studied by ecologists, a biotic community and its abiotic environment but very difficult to define or delimit. “Interaction or energy transformation between abiotic (climate, geology, soils), biotic factors (primary and secondary production), and humans” Ecosystem includes primary producers (plants), decomposers, and detritivores, a pool of dead organic matter, herbivores, carnivores, and parasites plus the physiochemical environment that provides living conditions and acts as both a SOURCE and a SINK for energy and matter.
Use of the term ecosystem COMMON USE SAVANNA ECOSYSTEM FOREST ECOSYSTEM OR SPECIFIC: “San Francisco Bay ecosystem” Ecosystem as a unit for system analysis We cannot see ecosystems, only landscapes. Ecosystems are always open systems We choose the interactive variables, and have to set arbitrary or practical boundaries in order to be able to study an ecosystem
Ecosystem ecology in practice involves the holisticapproach and is usually very difficult because of numerous synergistic effects and interactions. Inevitably 'broad-brush' 'black-box' approach. Holistic approach Aluminium (Al)
Some Definitions Standing crop – living organisms within a unit area Biomass – mass of living matter per unit area or unit volume of water (e.g. t ha-1, g cm-2) Primary production – fixation of energy by autotrophs in an ecosystem Rate of primary production – amount of energy fixed over some interval of time Gross primary production (GPP) – measure of total amount of dry matter produced by autotrophs by photosynthesis in an ecosystem. Units of dry weight per unit area per unit time (e.g. kg ha-1 yr-1) But all organisms respire and some of the GPP is converted back into CO2 and water by respiratory heat (RA – autotrophic respiration)
Net primary production (NPP) – overall gain of dry weight after autotrophic respiration. Same units as GPP. The amount of energy available to consumers in an ecosystem GPP = Respiration (RA) + NPP NPP = GPP – Respiration (RA) Terrestrial GPP 2.7 x NPP Ocean GPP 1.5 x NPP GPP or NPP measured as rate of carbon uptake or by the amount of biomass produced or oxygen produced Secondary productivity – rate of biomass production by heterotrophs (bacteria, fungi, and animals) Net ecosystem productivity (NEP: units as for NPP and GPP) – recognises that C fixed in GPP can leave the system as inorganic C (e.g. CO2) via autotrophic respiration (RA) or consumption by heterotrophic respiration (RH) Total ecosystem respiration (RE) = RA + RH NEP = GPP - RE = GPP - RA - RH
If GPP > RE, ecosystem is fixing carbon faster than it is being released, and the system is thus a carbon sink If RE > GPP, carbon is released faster than it is fixed and the system is a net carbon source How can RE exceed GPP? Ecosystem can receive organic matter other than by its own photosynthesis, e.g. import of dead organic matter produced elsewhere Autochthonous – organic matter produced by photosynthesis within ecosystem’s boundaries Allochthonous – organic matter imported from outside ecosystem’s boundaries Trophic structure in an ecosystem – species arranged into trophic levels based on the major source of their nutrition Trophic level – position on a food web determined by the number of transfers of energy from primary producers to that level
Trophic Levels Fourth trophic level (large carnivores) Third trophic level (carnivores) Primary consumers (herbivores) Primary producers (plants) Inorganic energy (solar energy) plus water, CO2, etc.
Global Primary Production NPP of Earth about 105 petagrams of carbon per year (1 petagram (Pg) = 1015 g) Terrestrial ecosystems 56.4 Pg C yr-1 Aquatic ecosystems 48.3 Pg C yr-1
Although oceans 72% of Earth’s surface, account for 46% of Earth’s total NPP On land, tropical rainforest and savannas account for 60% of terrestrial NPP and 32% of Earth’s total NPP
Forest biomes show trend of increasing GPP with decreasing latitude
Grassland biomes show similar trend in above-ground NPP (ANPP) and below-ground NPP (BNPP)
In aquatic systems, similar latitudinal gradient in GPP of lakes. Not in oceans where GPP more limited by nutrients and is high where there are upwellings of nutrient-rich waters, even at high latitudes and hence low temperatures. Terrestrial trends suggest that radiation (a resource) and hence temperature (a condition) may limit productivity. But other factors frequently constrain productivity, even within narrow limits.
Patterns of Terrestrial Primary Production Mainly determined by temp and moisture at biome scale. Terrestrial biomes in World Vegetation Biomes (Lecture 6) differ in their NPP
Can we combine temperature and moisture into a robust predictor of NPP? Actual evapotranspiration (AET) is total amount of water that evaporates and transpires off a landscape in a year. Units are mm water yr-1. AET influenced by both temperature and moisture. Good predictor of NPP at biome scale. Evapotranspiration and above-ground primary production
Important to note that AET has not been measured. It is estimated from latitude, mean monthly temperature, and mean monthly precipitation. Also AET is bound to be greater the more plant leaf area there is, as large leaves increase chances of water being transpired or evaporated rather than reaching the soil. In addition, NPP will be greatest in communities with large leaf areas. NPP and AET are not strictly independent variables – both are functions of leaf area, in particular leaf area index – number of leaves a typical vertical ray of sun-light passes through before hitting soil (range from <1 to >9 globally).
What determines variation in primary production within similar ecosystems? Temperate grasslands in central US Major influence of annual precipitation
Well known to farmers that productivity can be increased by adding fertilizers to soil. Liebig (1840) nutrients limited plant growth. At fine scale, soil fertility can influence productivity.
Addition of N, P, and K to Alaskan arctic tundra 2-4 years, NPP increased by 23-300% at all sites Adding fertilizer to arctic tundra
Colorado alpine tundra Added P, N, or N + P to dry and wet meadow tundra Large effects (relative to control) in dry meadows N may be limiting in dry meadow N + P may be limiting in wet meadow. Effect of fertilizers on wet and dry alpine tundra environments
How important is nitrogen-limitation on terrestrial net primary production? Le Bauer and Treseder 2008 Ecology 89: 371-379 126 Nitrogen addition terrestrial experiments world-wide. Looked at effects on NPP ('meta-analysis') Used response ratio R = ANPPN/ANPPCTRL where ANPP = above-ground NPP, N = nitrogen addition, and CTRL = control R = 1.29 for all experiments
Are there any relationships between R (measure of N limitation) and latitude or climate? Suggests that global N and C cycles interact strongly and that geography can influence ecosystem response to N within certain biome types (e.g. tundra, wetlands, grasslands).
Seasonal and annual trends in terrestrial primary production (GPP) Can vary in an ecosystem by a factor of 2, presumably due to annual fluctuations in temperature and rainfall Within a year, GPP depends on seasonal variations in conditions, especially temperature and the length of the growing season Period of high GPP longer in temperate forests than boreal forests
Summary of factors limiting primary production in terrestrial ecosystems Resources: Solar radiation, CO2, Water, Soil nutrients Condition: Temperature • Remember that • terrestrial systems use radiation inefficiently (self-shading) • photosynthetically active radiation may be limiting in some systems (e.g. C4 plants) • shortage of water is often a critical limiting factor • temperature and precipitation interact (‘energy-water’ model) • soil texture can influence productivity (dry vs. mesic) • length of growing season can be very important (tropics vs. boreal) • nutrient availability can also be limiting (N, P) • See Begon et al. (2006) pp. 505-511 for further details
Patterns of Aquatic Primary Production 72% world is covered by water, but only 46% of world's NPP is from aquatic systems.
Why lower NPP in aquatic systems? Cannot be a shortage of water! Some systems have high NPP (algal beds, swamps, coral reefs); ocean has low NPP (less than tundra!) Why is the sea blue? Physicist's answer – blue light with its short wavelength is less likely to be absorbed than red or green light. Light reflected back to our eyes is most likely to be blue. Biologist's answer – it is blue because it is not green with plants! So why are terrestrial systems mainly green and aquatic systems mainly blue? Most aquatic systems are starved of nutrients.
What determines algal biomass? Phosphorus concentration and algal biomass in lakes
What is the relation between algal biomass and rate of primary production?
Test ideas on aquatic productivity by whole-lake ecosystem manipulations. Experimental Lakes Area, Ontario, Canada. Lake 226 divided into sub-basins C added to one basin C, N, and P to other basin 1973-1980. Measured phytoplankton biomass before, during, and after fertilization and in control lake.
Clear that nutrient availability, especially phosphorus and nitrogen, controls rate of primary production in freshwater ecosystems. What about marine ecosystems? Much more difficult to study!
Main depth zones in the ocean – continental shelf, continental slope, abyssal plain
Main vertical life zones in the ocean. Almost all life depends on the phytoplankton growth in the epipelagic zone (0 - 150 m depth)