Download
1 / 16
160 likes | 317 Views
ANOVA Randomized Block Models 2-Factor Without Replication. Reducing Variability. Remember -- we are more sure of our results if we can reduce variability. Also we may feel that more than one factor affects the outcome of the experiment.

E N D
ANOVA Randomized Block Models 2-Factor Without Replication
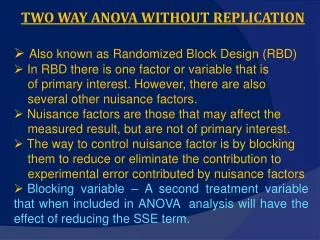
Reducing Variability • Remember -- we are more sure of our results if we can reduce variability. • Also we may feel that more than one factor affects the outcome of the experiment. • Both of these concerns are tackled by looking at multifactor designs. • In this module we will only look at “block” designs. • Excel: 2-Factor Without Replication
“Pairing Things Up” • Recall that for the difference in population means, one design was a matched pairs design which could be used in an attempt to reduce variability in certain situations. • Consider the situation where we are trying to decide if the learning mode affects the score on the final exam. • We could have been unlucky and by chance selected people that were “good in math” in one group and not so good in math in another group, clouding the issue of whether it was the learning mode that affected the final exam grades.
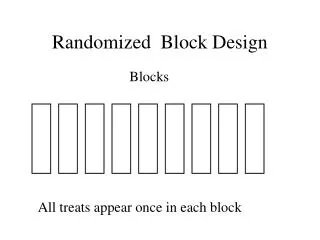
Randomized BlocksEXCEL: 2 Factor Without Replication • Like a matched pairs experiment for more than two populations • Assumptions • Experiment consists of a series of b blocks for each of k levels of the treatments. • One observation is selected randomly and independently from each block for each treatment level each of which is assumed to have normal distribution. • The standard deviations for each treatment-block combination are equal.
Example • A modeler wishes to create an experimental design so that each teaching format has one person who scored on the Math portion of the SAT: • ≥700 • 600-700 • 500-600 • 400-500 • < 400 • Begin by calculating: • Treatment Means • Block Means • Grand Mean
DATA: Exam GradeBlocked By SAT Score Treatments Blocks Grand meanx Lecture Text Videotape Internet SAT ≥ 700 94 80 88 90 600-700 85 75 80 76 500-600 90 72 66 80 400-500 64 60 75 77 <400 67 58 51 72 xBl 88 79 77 69 62 xTr 80 69 72 79 75
Sums Of Squares/DF • Degrees of Freedom (DF) -- • Total = n-1 • Treatments = #Levels - 1 = k-1 • Blocks = #Blocks -1 = b-1 • Error = DFT-(DFTr + DFBl) = n-k-b+1 • Sum of Squares (SS) is divided into: • Total -- SST = S(xij- x)2 • Treatment -- SSTr = Sb∙(xTj - x)2 • Block -- SSBl = Sk∙(xBi - x)2 • Error -- SSE = SST – (SSTr + SSBl)
Partitioning the Sums of Squares and the Degrees of Freedom Number DF SS • Levels of the factor: k k-1 SSTr • Different blocks: b b-1 SSBl Thus • Total observations n=kb n-1 SST Subtracting • Error (n-1)- ((k-1)+(b-1)) SSE = SST– (SSTr+ SSBl)
MS and F tests • MSTr = SSTr/DFTr • MSBl = SSBl/DFBl • MSE = SSE/DFE • Can we conclude treatment means differ? • F test with F = MSTr/MSE compared to F.05,DFTr,DFE • Can we conclude block means differ? • F test with F = MSBl/MSE compared to F.05,DFBl,DFE
Hand Calculations • Sum of Squares: • SST = (94-75)2+ (85-75)2 +…+(72-75)2 = 2534 • SSTr = 5((80-75)2+(69-75)2+(72-75)2+(79-75)2)= 430 • SSBl = 4((88-75)2+(79-75)2+(77-75)2+(69-75)2+(62-75)2)= 1576 • SSE = SST - SSTr - SSBl = 2534 – (430 + 1576) = 528 • DF -- • Total = DFT= n-1 = 19 • Treatments = DFTr = #Levels - 1 = k-1 = 3 • Blocks = DFBl = #Blocks -1 = b-1 = 4 • Error = DFT- (DFTr + DFBl) = 19-3-4 = 12
Can We Conclude the Treatment Means Differ? H0: µT1 = µT2 = µT3 = µT4 HA: At least on of these µTj’s differs from the others Select α = .05 Reject H0 (Accept HA) if: F = MSTr/MSE > F.05, 3,12 = 3.49 Calculations: MSTr = 430/3 =143.33 MSE = 528/12 = 44 F = 143.33/44 =3.26 3.26 < 3.49 Cannot conclude a difference in the treatment means
Can We Conclude the Block Means Differ? H0: µB1 = µB2 = µB3 = µB4 = µB5 HA: At least one of these µBi’s differs from the others Select α = .05 Reject H0 (Accept HA) if: F = MSBl/MSE > F.05, 4,12 = 3.26 Calculations: MSBl = 1576/4 = 394 MSE = 528/12 = 44 F = 394/44 = 8.95 8.95 > 3.26 Can conclude a difference in the block means
Randomized Block Output Blocks Treatments p-value for Blocks p-value for Treatments Low -- Can conclude SAT affects grade High -- Cannot conclude teaching format affects grade
Review • Blocks tend to reduce variability • Two Factor Without Replication (Randomized Block) • Assumptions • Degrees of Freedom • Sum of Squares • Mean Squares • F tests for • Treatments • Blocks • Excel